概要
この項はO’REILLYの「Pythonではじめる機械学習」の「2.3.3.6 線形モデルによる多クラス分類」を自分なりに理解しやすいようにトレースしたもの。扱いやすい仮想のデータセットを生成し、LinearSVCモデルでこれらを分類する流れを例示している。
例えば特徴量x1~xnのデータxをC1, C2の2クラスに分類する線形モデルは以下とおり。
(1) 
yの符号によってどちらのクラスに分類されるかを決定するが、1つの式で3つ以上のクラスを分類することはできない(ただし一般化線形モデル(GLM)であるLogistic回帰は多クラス分類が可能)。
このような2クラス分類を多クラス分類に拡張する方法の一つが1対その他(one-vs-rest, one-vs-the-rest, 1vR)という考え方で、1つの式によって、あるクラスとその他すべてのクラスを分けようというもの。この式の形は(1)と同じで、yの値は与えられたデータがそのクラスに属する確信度(confidence)を表す。クラスの数だけこの分類器(one-vs-the-rest-classifier)を準備し、あるデータが与えられたとき、最も確信度が高いクラスに属すると考える。たとえばn個の特徴量を持つデータの3クラス分類の場合、次のように3つの分類器を準備し、与えられたデータxはycの値が最も大きいクラスに属する。
(2) 
LinearSVCによる多クラス分類の例
データの準備
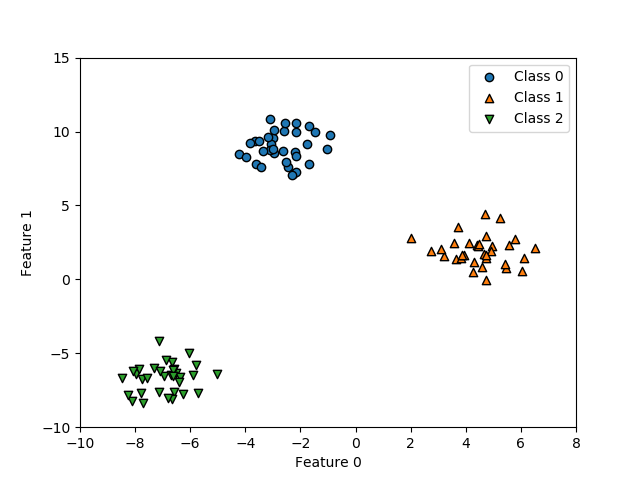
準備として、shikit-leran.datasetsのmake_blobs()で、2つの特徴量と3つのクラスのデータセットを生成する。

|
1 2 3 4 5 6 7 8 9 10 11 12 13 14 15 16 17 18 19 20 21 22 23 24 |
import numpy as np import matplotlib.pyplot as plt from sklearn.datasets import make_blobs X, y = make_blobs(random_state=42) fig, ax = plt.subplots() f0_min, f0_max = -10, 8 f1_min, f1_max = -10, 15 markers = ['o', '^', 'v'] for cls, marker in zip(range(3), markers): x = X[y==cls] ax.scatter(x[:, 0], x[:, 1], ec='k', marker=marker, label="Class {}".format(cls)) ax.set_xlim(f0_min, f0_max) ax.set_ylim(f1_min, f1_max) ax.set_xlabel("Feature 0") ax.set_ylabel("Feature 1") ax.legend() plt.show() |
LinearSVCによる学習
学習とモデルの形
scikit-learn.linear_modelのLinearSVC(Linear Support Vector Classification)は多クラス分類のモデルを提供する。このモデルをmake_blobs()で生成したデータで学習させると、3行2列の係数(LinearSVC.coef_)と3要素の切片(LinearSVC.intercept_)を得る。
|
1 2 3 4 5 6 7 8 9 10 11 12 13 14 15 16 17 18 19 20 21 22 |
import numpy as np import matplotlib.pyplot as plt from pandas import DataFrame from sklearn.datasets import make_blobs from sklearn.svm import LinearSVC X, y = make_blobs(random_state=42) df = DataFrame(X, columns=["f0", "f1"]) df['target'] = y linsvm = LinearSVC().fit(X, y) w = linsvm.coef_ b = linsvm.intercept_ print("Intercept: {}".format(b)) print("Coefficients(class, feature):\n{}".format(w)) # Intercept: [-1.07745476 0.13140569 -0.08604816] # Coefficients(class, feature): # [[-0.17491916 0.23140527] # [ 0.47621794 -0.06937226] # [-0.18914243 -0.20399679]] |
これらの係数の行と切片の要素は分類されるべきクラス、係数の列は特徴量に対応している。クラスに対するインデックスをc = 0, 1, 2、特徴量f0, f1に対するインデックスをf= 0, 1とすると、上記の結果は以下のような意味になる。
(3) ![Rendered by QuickLaTeX.com \begin{align*} w_{cf} &= \left[ \begin{array}{rrr} -0.17492222 & 0.23140089 \\ 0.4762125 & -0.06936704 \\ -0.18914556 & -0.20399715 \end{array} \right] \\ b_c &= [-1.07745632 \quad 0.13140349 \quad -0.08604899] \end{align*}](http://taustation.com/wp1/wp-content/ql-cache/quicklatex.com-8fbdc9a0c6266b87c93914dfd375a1e0_l3.png)
これらの係数、切片を用いたクラス分類の予測式は以下の通りで、LinearSVCではdecision function(決定関数)とされている。
(4) ![]()
あるデータの特徴量f0, f1に対して上記のycが正の時にはそのデータはクラスc、負の時にはクラスc以外であると判定される。
coef_やintercept_の値は、実行ごとにわずかに異なる(10−6くらいのオーダー)。LinearSVCのコンストラクターの引数にrandom_stateが含まれていて、ドキュメントに以下のような記述があった。
The underlying C implementation uses a random number generator to select features when fitting the model. It is thus not uncommon to have slightly different results for the same input data. If that happens, try with a smaller tol parameter.The underlying implementation, liblinear, uses a sparse internal representation for the data that will incur a memory copy.
Predict output may not match that of standalone liblinear in certain cases. See differences from liblinear in the narrative documentation.
訓練データに対する決定関数・確信度
データセットの100個の各データに対してyc (c = 0, 1, 2)を計算した結果は以下の通り。
|
1 2 3 4 5 6 7 8 9 10 11 12 13 14 15 16 17 18 19 20 21 |
df['y0'] = b[0] + w[0, 0] * df['f0'] + w[0, 1] * df['f1'] df['y1'] = b[1] + w[1, 0] * df['f0'] + w[1, 1] * df['f1'] df['y2'] = b[2] + w[2, 0] * df['f0'] + w[2, 1] * df['f1'] print(df) # DataFrame adding Confidences: # f0 f1 target y0 y1 y2 # 0 -7.726421 -8.394957 2 -1.668593 -2.965677 3.087890 # 1 5.453396 0.742305 1 -1.859585 2.676915 -1.268945 # 2 -2.978672 9.556846 0 1.655077 -1.950071 -1.472221 # 3 6.042673 0.571319 1 -2.002228 2.969401 -1.345521 # 4 -6.521840 -6.319325 2 -1.398985 -2.536026 2.436631 # .. ... ... ... ... ... ... # 95 -3.186120 9.625962 0 1.707357 -2.053656 -1.447083 # 96 -1.478198 9.945566 0 1.482567 -1.262485 -1.835322 # 97 4.478593 2.377221 1 -1.310745 2.099279 -1.418086 # 98 -5.796576 -5.826308 2 -1.411761 -2.224844 2.198878 # 99 -3.348415 8.705074 0 1.522647 -2.067060 -1.228528 # # [100 rows x 6 columns] |
たとえばNo.0のデータはクラス2に属するので確信度はy2が正となり、他の2つのクラスに対しては負の値になっている。
上の計算ではintercept_とcoef_を使ってもともとの決定関数の式から確信度を計算したが、LinearSVCのdecition_function()メソッドで同じ結果を得ることができる。たとえばNo.0~2のデータで計算してみると以下の通りで同じ結果。
|
1 2 3 4 5 6 7 |
print("decision_function values for first 3 data") print(linsvm.decision_function(df.iloc[0:3, 0:2])) # decision_function values for first 3 data # [[-1.668593 -2.96567746 3.08789015] # [-1.85958483 2.67691534 -1.26894468] # [ 1.65507664 -1.95007141 -1.47222084]] |
テストデータに対する予測
3つのテストデータを用意してクラス分類をしてみる。
|
1 2 3 4 5 6 7 8 9 10 11 12 13 14 15 16 17 |
X_test = np.array([[4, -2], [-2, 2], [-6, 5]]) preds = linsvm.predict(X_test) print("Prediction:") for x_test, pred in zip(X_test, preds): print("{} -> {}".format(x_test, pred)) print() print("Confidences of 3 points:\n{}".format(linsvm.decision_function(X_test))) # Prediction: # [ 4 -2] -> 1 # [-2 2] -> 2 # [-6 5] -> 0 # # Confidences of 3 points: # [[-2.23994194 2.17502199 -0.43462432] # [-0.2648059 -0.95977473 -0.11575688] # [ 1.12908656 -3.07276329 0.02882249]] |
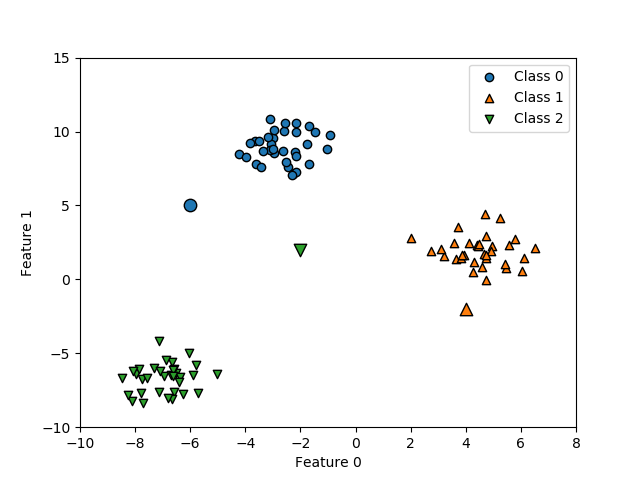
各データとも分類されたクラスに対応する確信度が最も高い。ただし2つ目のデータについては全てのクラスに対する確信度が負の値で、その中で最も値が大きいクラス2に分類されている。
これらを図示すると以下のようになり、クラス2に分類された▼のデータは確かにどのデータにも属していそうな位置にある。

以上のコードをまとめておく。
|
1 2 3 4 5 6 7 8 9 10 11 12 13 14 15 16 17 18 19 20 21 22 23 24 25 26 27 28 29 30 31 32 33 34 35 36 37 38 39 40 41 42 43 44 45 46 47 48 49 50 51 52 53 54 55 56 57 58 59 60 61 62 63 64 65 |
import numpy as np import matplotlib.pyplot as plt from pandas import DataFrame from sklearn.datasets import make_blobs from sklearn.svm import LinearSVC X, y = make_blobs(random_state=42) df = DataFrame(X, columns=["f0", "f1"]) df['target'] = y linsvm = LinearSVC().fit(X, y) w = linsvm.coef_ b = linsvm.intercept_ print("Intercept: {}".format(b)) print("Coefficients(class, feature):\n{}".format(w)) print() df['y0'] = b[0] + w[0, 0] * df['f0'] + w[0, 1] * df['f1'] df['y1'] = b[1] + w[1, 0] * df['f0'] + w[1, 1] * df['f1'] df['y2'] = b[2] + w[2, 0] * df['f0'] + w[2, 1] * df['f1'] print("DataFrame adding Confidences:\n{}".format(df)) print() print("decision_function values for first 3 data") print(linsvm.decision_function(df.iloc[0:3, 0:2])) print() X_test = np.array([[4, -2], [-2, 2], [-6, 5]]) preds = linsvm.predict(X_test) print("Prediction:") for x_test, pred in zip(X_test, preds): print("{} -> {}".format(x_test, pred)) print() print("Confidences of 3 points:\n{}".format(linsvm.decision_function(X_test))) fig, ax = plt.subplots() f0_min, f0_max = -10, 8 f1_min, f1_max = -10, 15 markers = ['o', '^', 'v'] for cls, marker in zip(range(3), markers): x = X[y==cls] ax.scatter(x[:, 0], x[:, 1], ec='k', marker=marker, label="Class {}".format(cls)) ax.scatter(X_test[0][0], X_test[0][1], ec='k', c='tab:orange', marker=markers[1], s=80) ax.scatter(X_test[1][0], X_test[1][1], ec='k', c='tab:green', marker=markers[2], s=80) ax.scatter(X_test[2][0], X_test[2][1], ec='k', c='tab:blue', marker=markers[0], s=80) ax.set_xlim(f0_min, f0_max) ax.set_ylim(f1_min, f1_max) ax.set_xlabel("Feature 0") ax.set_ylabel("Feature 1") ax.legend() plt.show() |
LinearSVCの決定境界
クラスごとのone-vs-restの決定境界
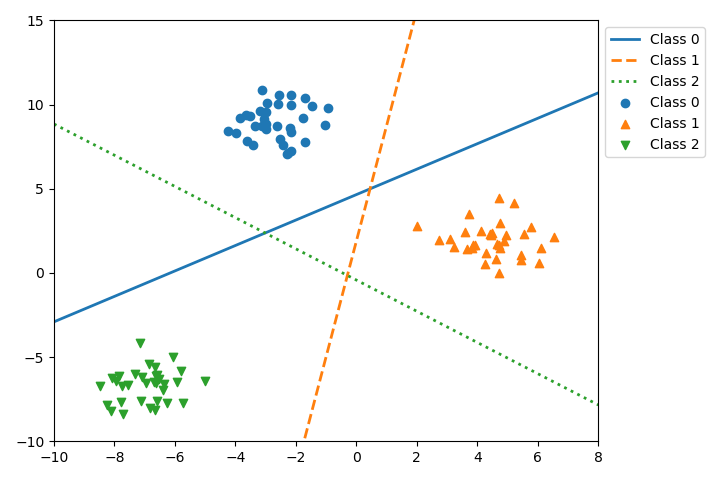
blobsデータは明確に分かれた3つのクラスに分類され、それぞれに対する決定関数の切片と係数が得られた。そこで、各決定関数の決定関数の意思決定境界(decision boundary)を描いてみる。意思決定境界は決定関数の値がゼロとなる線なので、以下の式で表される。
(5) ![]()
3つの決定関数について決定境界を描いたのが以下の結果。

たとえばClass 0の実線は、Class 0の塊とその他(Class1, Class 2)の塊を1対その他で分けている。この線の上側では確信度はプラスで、下側ではマイナスとなっている。
|
1 2 3 4 5 6 7 8 9 10 11 12 13 14 15 16 17 18 19 20 21 22 23 24 25 26 27 28 29 30 31 32 33 34 35 36 |
import matplotlib.pyplot as plt from pandas import DataFrame from sklearn.datasets import make_blobs from sklearn.svm import LinearSVC f0_min, f0_max = -10, 8 f1_min, f1_max = -10, 15 X, y = make_blobs(random_state=42) df = DataFrame(X, columns=["feature-0", "feature-1"]) df['target'] = y linsvm = LinearSVC().fit(X, y) w = linsvm.coef_ b = linsvm.intercept_ fig, ax = plt.subplots(figsize=(7.2, 4.8)) markers = ['o', '^', 'v'] line_styles = ['solid', 'dashed', 'dotted'] for c, marker, ls in zip(range(3), markers, line_styles): x = X[y==c] ax.scatter(x[:, 0], x[:, 1], marker=marker, label="Class {}".format(c)) f1_left = -(b[c] + w[c, 0] * f0_min) / w[c, 1] f1_right = -(b[c] + w[c, 0] * f0_max) / w[c, 1] ax.plot([f0_min, f0_max], [f1_left, f1_right], linestyle=ls, linewidth=2, label="Class {}".format(c)) ax.set_xlim(f0_min, f0_max) ax.set_ylim(f1_min, f1_max) ax.legend(bbox_to_anchor=(1, 1)) fig.tight_layout() plt.show() |
全体を融合した決定境界
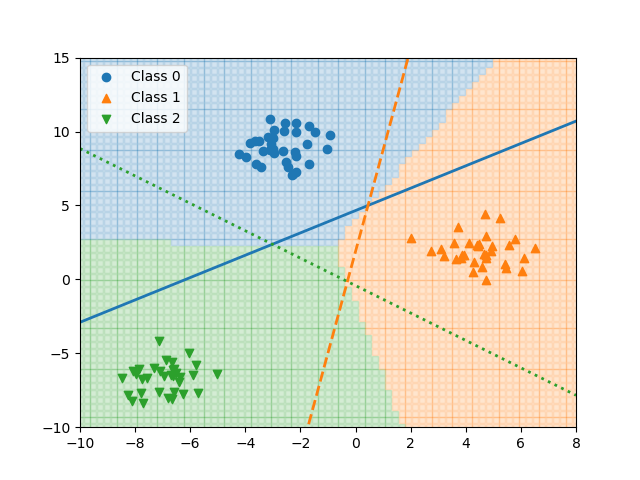
先の図の中で、各クラスの塊の近くでは、そのクラスの決定関数の値はプラスで他はマイナスとなっているが、真ん中の三角形の中や、その対角にある三角形の領域では、複数の確信度がマイナスあるいはプラスとなる。このような場合には、全クラスに対して着目するデータの決定関数値を計算し、その確信度が最も大きいクラスをそのデータのクラスラベルとして与える。
以下の図は、領域内の点について全て確信度を計算し、各点において最も確信度が大きいクラスをその点のクラスとして表現した図である。

各領域の境界が3つの決定関数から導かれた意思決定境界であり、その線上で決定関数の値が等しくなっている。
|
1 2 3 4 5 6 7 8 9 10 11 12 13 14 15 16 17 18 19 20 21 22 23 24 25 26 27 28 29 30 31 32 33 34 35 36 37 38 39 40 41 42 |
import numpy as np import matplotlib.pyplot as plt from pandas import DataFrame from sklearn.datasets import make_blobs from sklearn.svm import LinearSVC f0_min, f0_max = -10, 8 f1_min, f1_max = -10, 15 X, y = make_blobs(random_state=42) df = DataFrame(X, columns=["feature-0", "feature-1"]) df['target'] = y n_classes = max(y + 1) linsvm = LinearSVC().fit(X, y) w = linsvm.coef_ b = linsvm.intercept_ markers = ['o', '^', 'v'] line_styles = ['solid', 'dashed', 'dotted'] colors = ['tab:blue', 'tab:orange', 'tab:green'] fig, ax = plt.subplots() for f0 in np.linspace(f0_min, f0_max, 75): for f1 in np.linspace(f1_min, f1_max, 55): conf = [b[c] + w[c, 0] * f0 + w[c, 1] * f1 for c in range(n_classes)] ax.scatter(f0, f1, c=colors[np.argmax(conf)], marker='s', s=20, alpha=0.2) for c, marker, ls in zip(range(3), markers, line_styles): x = X[y==c] ax.scatter(x[:, 0], x[:, 1], marker=marker, label="Class {}".format(c)) f1_left = -(b[c] + w[c, 0] * f0_min) / w[c, 1] f1_right = -(b[c] + w[c, 0] * f0_max) / w[c, 1] ax.plot([f0_min, f0_max], [f1_left, f1_right], linestyle=ls, linewidth=2) ax.set_xlim(f0_min, f0_max) ax.set_ylim(f1_min, f1_max) ax.legend() plt.show() |
実際に数式を挟んで説明をして下さったので、非常に理解の助けになりました。
コメントありがとうございます。
私自身の理解のために整理したものですが、お役にたったようで幸いです。
なんとなく画像の解析方法に役立ちそうです。
ありがとうございます
コメントありがとうございます。
自身の勉強のために整理したものですが、少しでもお役に立てたのなら光栄です。