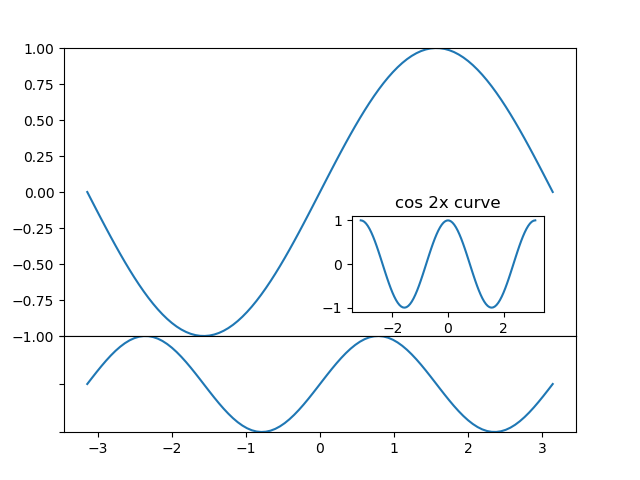
グラフを任意の位置に任意のサイズで表示する手順。
pyplot.axes(rect)
ここでrect = [left, bottom, width, height]で指定し、left, bottmはグラフの左下隅の位置、width, heightはグラフのサイズ。それぞれの値は、figureの範囲を0, 1とした場合の相対値。
|
1 2 3 4 5 6 7 8 9 10 11 12 13 14 15 16 17 18 19 20 21 22 23 24 25 26 |
import numpy as np import matplotlib.pyplot as plt x = np.linspace(-np.pi, np.pi, num=100, endpoint=True) y1 = np.sin(x) y2 = np.sin(x*2) y3 = np.cos(x*2) fig = plt.figure() ax1 = plt.axes([0.1, 0.3, 0.8, 0.6]) ax2 = plt.axes([0.1, 0.1, 0.8, 0.2]) ax3 = plt.axes([0.55, 0.35, 0.3, 0.2]) ax1.set_ylim(-1, 1) ax2.set_ylim(-1, 1) ax1.tick_params(labelbottom=False) ax2.tick_params(labelleft=False) ax3.set_title("cos 2x curve") ax1.plot(x, y1) ax2.plot(x, y2) ax3.plot(x, y3) plt.show() |
