基本
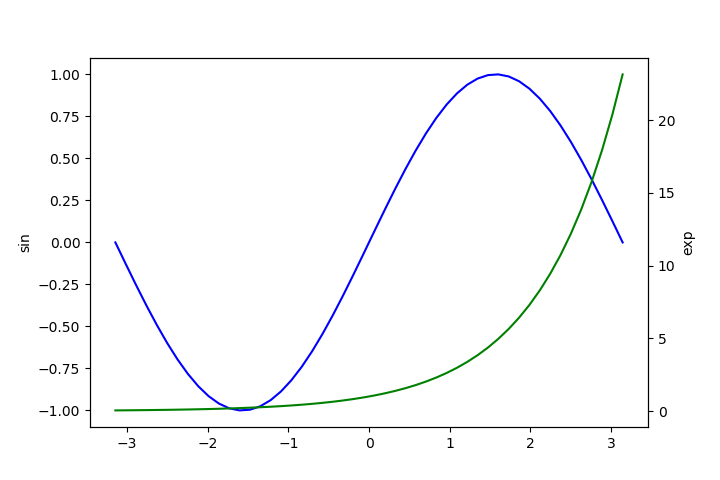
Axes.twinx()は元のAxesオブジェクトを複製する。ただし新たなAxesには横軸がなく縦軸が逆側にある。2つのグラフを、それぞれに対するy軸とともに重ねて表示したいときに使う。手順は以下の通り。
- 基本のAxesインスタンスを生成
- 基本のAxesインスタンスでtwinx()メソッドを実行して2軸目のAxesインスタンスを得る
- それぞれのAxesオブジェクトに対して描画、設定
|
1 2 3 4 5 6 7 8 9 10 11 12 13 14 15 16 17 18 |
import numpy as np import matplotlib.pyplot as plt x = np.linspace(-np.pi, np.pi) sin = np.sin(x) exp = np.exp(x) fig, axsin = plt.subplots(figsize=(7.2, 4.8)) plt.subplots_adjust(wspace=0.2) axexp = axsin.twinx() axsin.plot(x, sin, c='b') axexp.plot(x, exp, c='g') axsin.set_ylabel("sin") axexp.set_ylabel("exp") plt.show() |

凡例
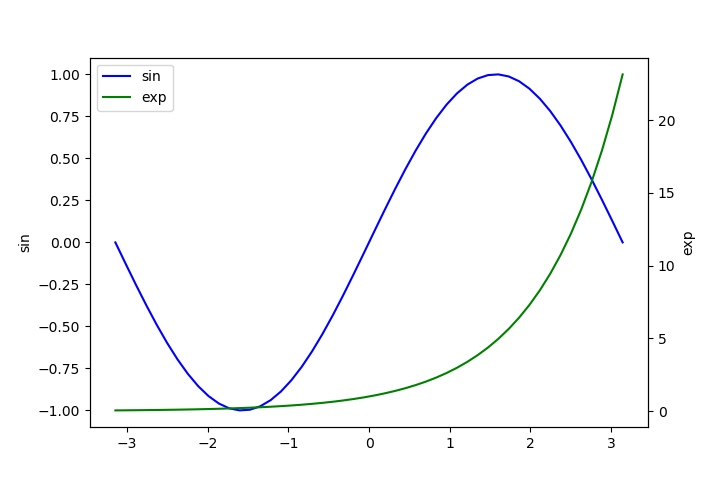
twinx()で得られたAxesと元のAxesは異なるインスタンスなので、それぞれの凡例を表示させると、ばらばらの位置になったり完全に重なったりしてしまう。
これらの凡例を一括して扱うには、handleとlabelを取得して結合する方法を使う。
|
1 2 3 4 5 6 7 8 9 10 11 12 13 14 15 16 17 18 19 20 21 22 |
import numpy as np import matplotlib.pyplot as plt x = np.linspace(-np.pi, np.pi) sin = np.sin(x) exp = np.exp(x) fig, axsin = plt.subplots(figsize=(7.2, 4.8)) axexp = axsin.twinx() axsin.plot(x, sin, c='b', label="sin") hs, ls = axsin.get_legend_handles_labels() axexp.plot(x, exp, c='g', label="exp") he, le = axexp.get_legend_handles_labels() axsin.set_ylabel("sin") axexp.set_ylabel("exp") axsin.legend(hs + he, ls + le, loc='upper left') plt.show() |
