概要
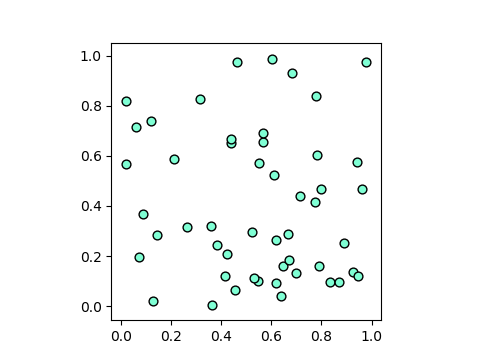
scatterはx座標とy座標のペアを与えて散布図を描く。
scatter(x, y, color/c=color, s=n, marker=marker, edgecolors=color)x、yは散布図の点の座標で、数値の場合は1点、配列の場合は複数の点を描く。color(またはc)とedgecolorはmatplotlibのcolor指定。markerはmatplotlibのmarkers指定。sはマーカーのサイズ。
基本形
|
1 2 3 4 5 6 7 8 9 10 11 12 13 14 15 |
import numpy as np import numpy.random as rnd import matplotlib.pyplot as plt rnd.seed(0) x = rnd.random(50) y = rnd.random(50) fig, ax = plt.subplots(figsize=(4.8, 3.6)) ax.scatter(x, y, s=40, marker='o', color='aquamarine', edgecolors='black') ax.set_aspect('equal') plt.show() |

複数系列
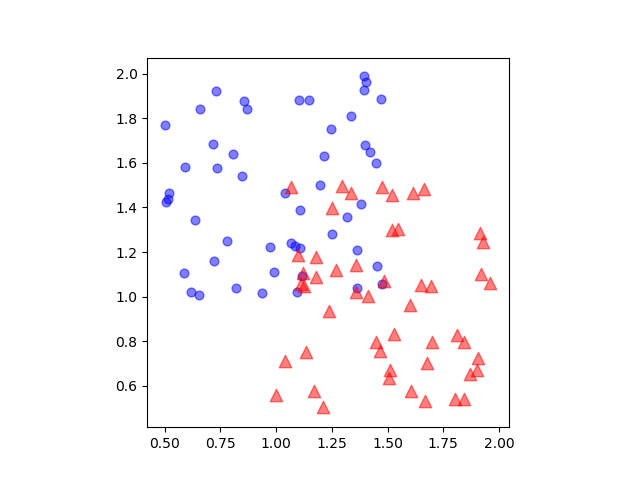
複数系列の場合は、系列ごとにscatterを実行する。
|
1 2 3 4 5 6 7 8 9 10 11 12 13 14 15 16 17 18 |
import numpy as np import numpy.random as rnd import matplotlib.pyplot as plt x1 = rnd.random(50) + 0.5 y1 = rnd.random(50) + 1 x2 = rnd.random(50) + 1 y2 = rnd.random(50) + 0.5 fig, ax = plt.subplots(figsize=(6.4, 4.8)) ax.scatter(x1, y1, marker='o', s=40, c='blue', alpha=0.5) ax.scatter(x2, y2, marker='^', s=80, color='red', alpha=0.5) ax.set_aspect('equal') plt.show() |
