概要
pyplot.subplot()によって、一つのウィンドウに複数のグラフを描画できる。
subplot(rows, cols, positon)

subplot(rcp)
rowsでグラフの行数、colsで列数を指定。positionはrows*colsの中での描画位置を1つの数値で指定し、1行1列目→1行2列目→・・・→2行1列目→2行2列目の順番に1から1つずつ増えていく。
ここで引数指定に2つの方法があって、rows, col, positionをそれぞれ1つの数値として指定する方法と、rcpの形で1つの数値として指定する方法がある。たとえば2行3列のグラフエリアの2行2列目を指定する場合は(2, 3, 5)か(235)となる。
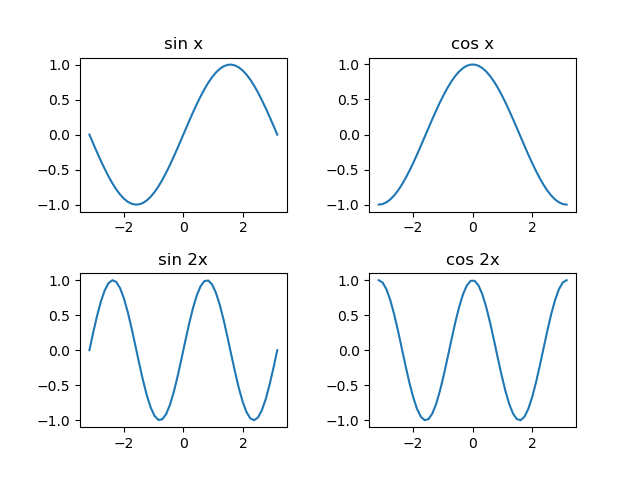
以下の例は、2×2のグラフを描画する例。
|
1 2 3 4 5 6 7 8 9 10 11 12 13 14 15 16 17 18 19 20 21 22 23 24 25 26 27 |
import numpy as np import matplotlib.pyplot as plt x = np.linspace(-np.pi, np.pi) y1 = np.sin(x) y2 = np.cos(x) y3 = np.sin(x*2) y4 = np.cos(x*2) plt.subplots_adjust(wspace=0.4, hspace=0.4) plt.subplot(2, 2, 1) plt.title("sin x") plt.plot(x, y1, label="sin x") plt.subplot(2, 2, 2) plt.title("cos x") plt.plot(x, y2) plt.subplot(223) plt.plot(x, y3) plt.subplot(224) plt.title("cos 2x") plt.plot(x, y4) plt.show() |
