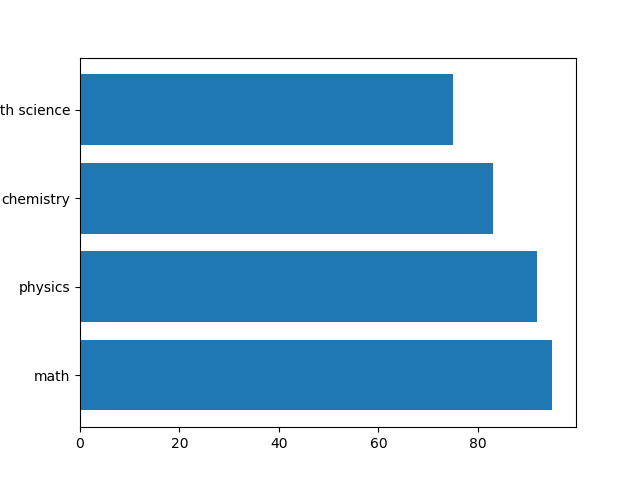
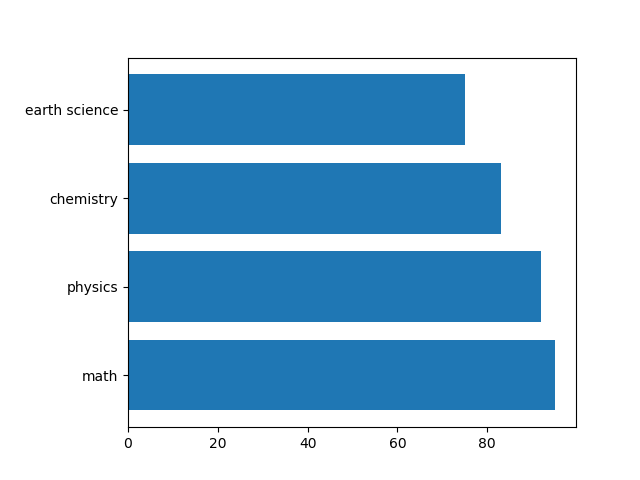
グラフのラベルがはみ出てしまう場合がある。

このようなときは、pyplotやfigureに対してsubplots_adjust()でleft、bottomなどの引数でマージンを指定する。
|
1 2 3 4 5 6 7 8 9 10 11 12 |
import numpy as np import matplotlib.pyplot as plt subjects = np.array(["math", "physics", "chemistry", "earth science"]) scores = np.array([95, 92, 83, 75]) fig, ax = plt.subplots() fig.subplots_adjust(left=0.2) ax.barh(subjects, scores) plt.show() |
