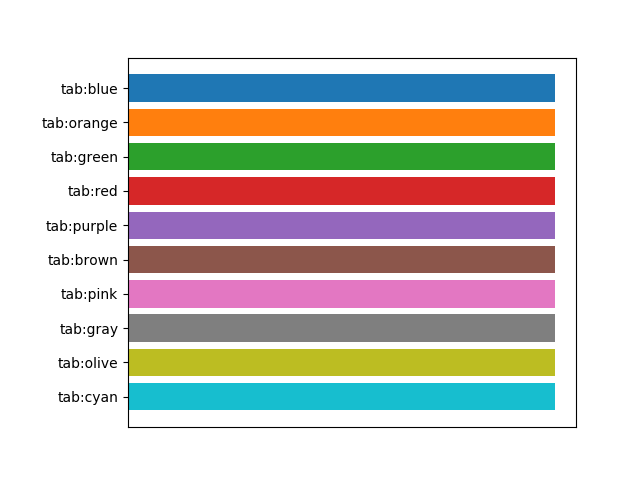
Pyplotのグラフを描くときに標準で使われる色を直接指定する方法。色名に"tab:blue"のように指定する。
|
1 2 3 4 5 6 7 8 9 10 11 12 13 14 15 16 17 18 19 20 21 22 23 24 25 26 |
import matplotlib.pyplot as plt color_names = [ "tab:blue", "tab:orange", "tab:green", "tab:red", "tab:purple", "tab:brown", "tab:pink", "tab:gray", "tab:olive", "tab:cyan", ] rev_colors = [c for c in color_names[::-1]] values = [1] * 10 fig, ax = plt.subplots() fig.subplots_adjust(left=0.2) ax.barh(rev_colors, values, color=rev_colors) ax.tick_params(bottom=False, labelbottom=False) plt.show() |
