概要
matplotlib.pyplot.imshow()は画像表示用のメソッドで、表示対象として、画像ファイルや画像情報を格納した配列を指定する。
pyplotやsubplotで直接実行するほか、Axesオブジェクトのメソッドとしても実行できる。
ピクセルデータのレンジのデフォルト設定と与えるデータのレンジによって予期しない結果になることもあり、vmin、vmaxを明示的に指定した方がよい。
画像ファイルの表示
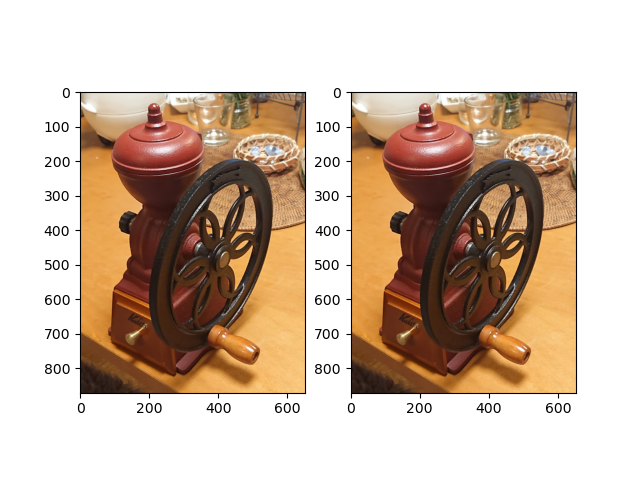
以下のコードは、JPEGファイルを読み込んで表示する。
ここではpyplot.subplotのメソッドとしてimshow()を実行している。画像が1つの場合、pyplot.imshow()でもよい。
1つは画像ファイルをそのまま引数にし、もう1つは画像ファイルを配列の形にしてから引数に渡している。画像の配列の形については後述。
|
1 2 3 4 5 6 7 8 9 10 11 12 13 14 15 16 17 18 19 20 21 22 23 24 25 26 27 28 29 30 31 32 33 34 35 36 37 38 39 40 41 |
import numpy as np import matplotlib.pyplot as plt from PIL import Image image = Image.open("./coffeemill.jpg") image_array = np.asarray(image) plt.subplot(121).imshow(image) plt.subplot(122).imshow(image_array) plt.show() print(image_array.shape) # (871, 653, 3) print(image_array) [[[171 147 111] [167 143 107] [170 147 113] ... [ 93 82 86] [ 92 81 87] [ 93 83 91]] [[170 146 110] [167 143 107] [170 147 113] ... [ 92 81 87] [ 85 76 81] [ 77 67 75]] ..... [[ 36 23 15] [ 37 24 16] [ 41 26 21] ... [248 196 123] [249 197 124] [247 195 122]]] |
配列の画像表示
基本形
imshow()は配列を引数にとることができる。
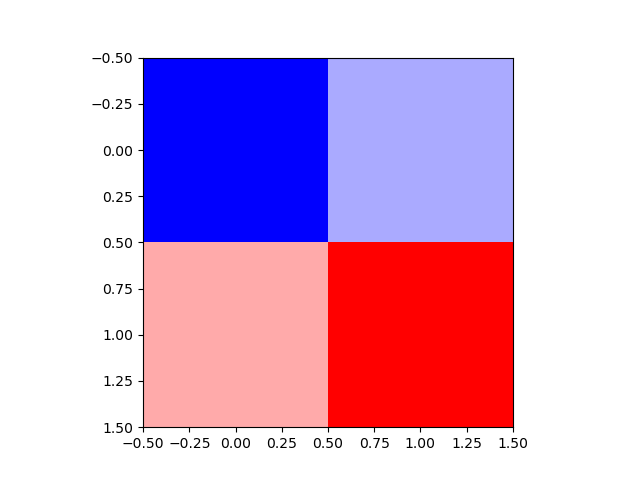
以下の例では、カラーマップを指定して2×2=4要素の2次元配列を表示している。最小値0がカラーマップbwrの青に、最大値255が赤に対応し、その間の数値の大きさに応じたカラーマップ上の色が選択されている(デフォルトのcmapはvirいdis)。
なお、この例ではpyplotから直接imshow()を実行している。
|
1 2 3 4 5 6 7 8 9 10 11 |
import numpy as np import matplotlib.pyplot as plt im_array = np.array([ [0, 85], [170, 255] ]) plt.imshow(im_array, cmap='bwr') plt.show() |
レンジ
imshow()に配列を渡して描画させるとき、数値のレンジに留意する必要がある。
デフォルトでは、imshow()は渡された配列の中の最小値と最大値をカラーマップの下限値と上限値に対応させ、線形にマッピングする。
なお、この例ではarray-likeとして2次元のリストを渡していて、Axesからimshow()を呼び出している。
|
1 2 3 4 5 6 7 8 9 10 11 12 13 14 15 16 |
import numpy as np import matplotlib.pyplot as plt images = [] images.append([[0, 0.5, 1]]) images.append([[0, 127, 255]]) images.append([[-1, 0, 1]]) images.append([[1000, 1000.5, 1001]]) print(images) fig, axs = plt.subplots(2, 2) for image, ax in zip(images, axs.flatten()): ax.imshow(image, cmap='bwr') plt.show() |
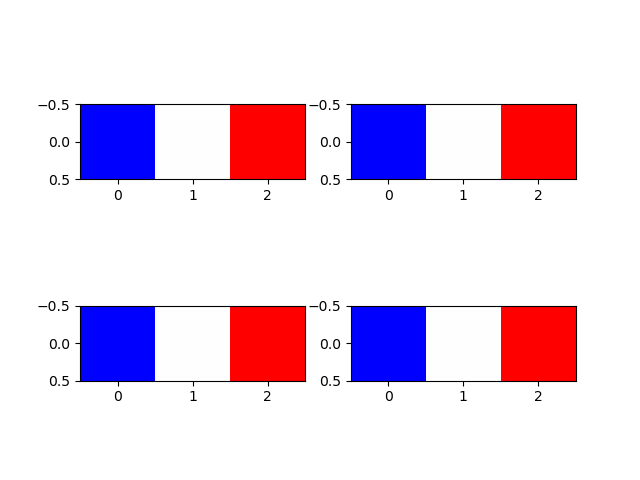
4つの配列はそれぞれ最小値と最大値が異なり、かつその中央の値を持つ。値は異なるが全て最小値がカラーマップbwrの下限値に対応する青、最大値が上限値に対応する赤、中央値は白となっている(特段フランス国旗を意図したものではない)。
viminとvmax
imshow()の引数でvminとvmaxを設定すると、配列の値に関わらず、vminとvmiaxをカラーマップの下限値と上限値に対応させる。
以下の例では最小値0、最大値1の2要素の配列を、vminとvmaxを変えてカラーマップbwrで描画させている。
|
1 2 3 4 5 6 7 8 9 10 11 12 13 14 15 16 17 |
import numpy as np import matplotlib.pyplot as plt image = [[0, 1]] fig, axs = plt.subplots(2, 2) axs[0, 0].imshow(image, cmap='bwr') axs[0, 0].set_title("Default") axs[0, 1].imshow(image, cmap='bwr', vmin=0, vmax=2) axs[0, 1].set_title("vmin=0, vmax=2") axs[1, 0].imshow(image, cmap='bwr', vmin=-1, vmax=2) axs[1, 0].set_title("vmin=-1, vmax=2") axs[1, 1].imshow(image, cmap='bwr', vmin=0.2, vmax=0.8) axs[1, 1].set_title("vmin=0.2, vmax=0.8") plt.show() |
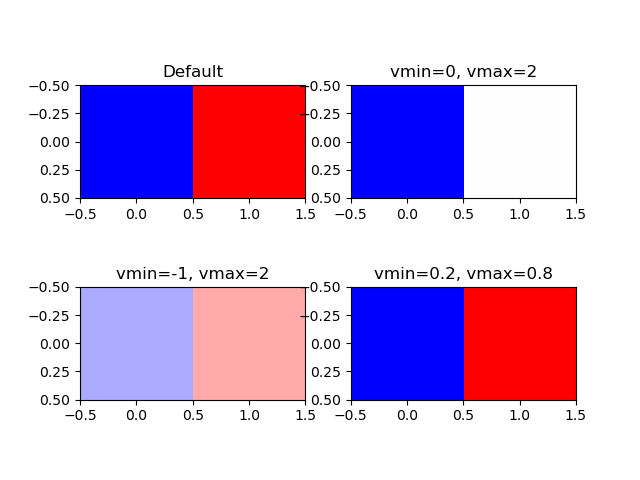
左上はデフォルトなので、最小値0がカラーマップ下限値に対応した青に、最大値1が上限値に対応した赤になっている。
右上はvmin=0で配列の最小値0と同じだが、vmax=2としている。このため配列の0はカラーマップ下限の青で、配列の1はカラーマップ中央の白になっている。
左下はvmin=-1も設定されているので、配列の0、1はカラーマップの左から1/3、2/3に相当する色となっている。
右下はvminとvmaxが配列の最小値と最大値の範囲より内側にある。このため、配列の最小値・最大値はそれぞれカラーマップの下限・上限に対応する青・赤となっている。
RGB
array-likeの次元が3次元になると、RGB/RGBA形式だと認識される。
- [rows, cols, 3]
- 3次元目のサイズが3の時はRGB表現と認識される。1次元目と2次元目はそれぞれ画像の行数と列数とみなされ、3次元目は3つの列がR, G, Bの値に対応する。
- [rows, cols, 4]
- 3次元目のサイズが4の時はRGBA表現と認識される。1次元目と2次元目はそれぞれ画像の行数と列数とみなされ、3次元目は3つの列がR, G, Bの値に対応し、4つ目の列が透明度に対応する。
R, G, B, Aの値は、配列のdtypeがint形式の時には0~255、floatの時には0~1の範囲が想定される。
以下の例の内容。
- 画像サイズを2行×4列として、R, G, Bごとに画像のピクセルデータを設定→shape=(3, 2, 4)
- ピクセル並び替え後の配列を4つ準備
- forループでピクセル並び替え
- 画像表示とデータ内容の表示
3次元配列のピクセルの並び替えは、泥臭くforループで回しているが、もっとエレガントな方法があるかもしれない(もとから(3, rows, cols)の形にしてくれればよかったのに)。
|
1 2 3 4 5 6 7 8 9 10 11 12 13 14 15 16 17 18 19 20 21 22 23 24 25 26 27 28 29 30 31 32 33 34 35 36 37 38 39 40 41 42 43 44 45 46 47 48 49 50 51 52 53 54 55 56 57 58 59 60 61 62 63 64 65 66 67 68 69 70 |
# --- --B -G- -GB # R-- R-B RG- RGB import numpy as np import matplotlib.pyplot as plt image_org = np.array([ [ [ 0, 0, 0, 0], [255, 255, 255, 255] ], [ [ 0, 0, 255, 255], [ 0, 0, 255, 255] ], [ [ 0, 255, 0, 255], [ 0, 255, 0, 255] ] ]) row = image_org.shape[1] col = image_org.shape[2] image_int1 = np.empty((row, col, 3), dtype=int) image_int2 = np.empty((row, col, 3), dtype=int) image_float1 = np.empty((row, col, 3), dtype=float) image_float2 = np.empty((row, col, 3), dtype=float) for m in range(row): for n in range(col): for rgb in range(3): image_int1[m, n, rgb] = image_org[rgb, m, n] image_int2[m, n, rgb] = image_org[rgb, m, n] /255 #-> all the pixels become BLACK image_float1[m, n, rgb] = image_org[rgb, m, n] image_float2[m, n, rgb] = image_org[rgb, m, n] / 255 #- >works, but # "Clipping input data to the valid range for imshow with RGB data ([0..1] for floats or [0..255] for integers)." fig, axs = plt.subplots(2, 2) axs[0, 0].imshow(image_int1) axs[0, 0].set_title("dtype=int, 0~255") axs[0, 1].imshow(image_int2) axs[0, 1].set_title("dtype=int, 0.0~1.0") axs[1, 0].imshow(image_float1) axs[1, 0].set_title("dtype=float, 0.0~255.0") axs[1, 1].imshow(image_float2) axs[1, 1].set_title("dtype=float, 0.0~1.0") plt.show() print("original image shape :{}".format(image_org.shape)) print("rearranged image shape:{}".format(image_int1.shape)) print("rearranged image:\n{}".format(image_int1)) # Clipping input data to the valid range for imshow with RGB data ([0..1] for floats or [0..255] for integers). # original image shape :(3, 2, 4) # rearranged image shape:(2, 4, 3) # rearranged image: # [[[ 0 0 0] # [ 0 0 255] # [ 0 255 0] # [ 0 255 255]] # # [[255 0 0] # [255 0 255] # [255 255 0] # [255 255 255]]] |
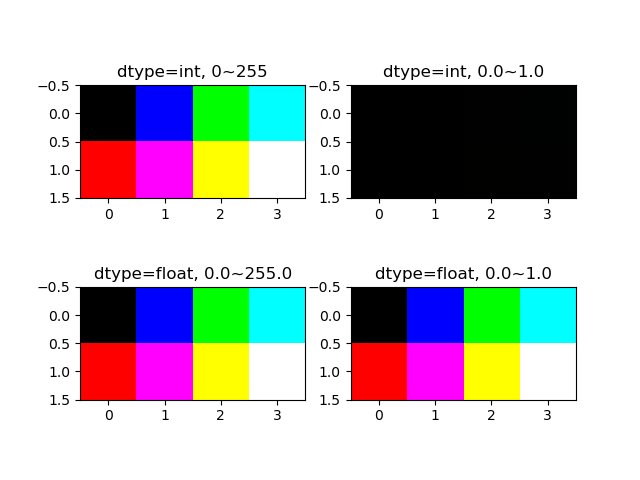
imshow()に渡す配列のdtypeがint型の時は、ピクセルデータのレンジが0~255になる。
- 左上は元の配列のままR, G,Bが0か255なので、想定した組み合わせの色となっている
- 右上は想定されているレンジに対して0.0~1.0の値を与えていることから、どのピクセルともR, G, Bが0か1(ほぼゼロ)となり黒くなっている(そのまま実行され、特にメッセ維持は出ない)
配列のdtypeがfloatの時は、ピクセルデータの想定レンジは0.0~1.0になる。
- 左下は最小値0と最大255を与えているが、結果は左上と同じで、
imshow()のデフォルトのレンジ0~255に変更されているようである(特にメッセージは出ない) - 右下は与えるピクセルデータを0.0~1.0としたところ、”入力データをクリップしている”というメッセージが出たが、レンジが修正されたらしく結果は意図通り
並べ替えた後の配列は、直感的にはわかりにくい形になっている。
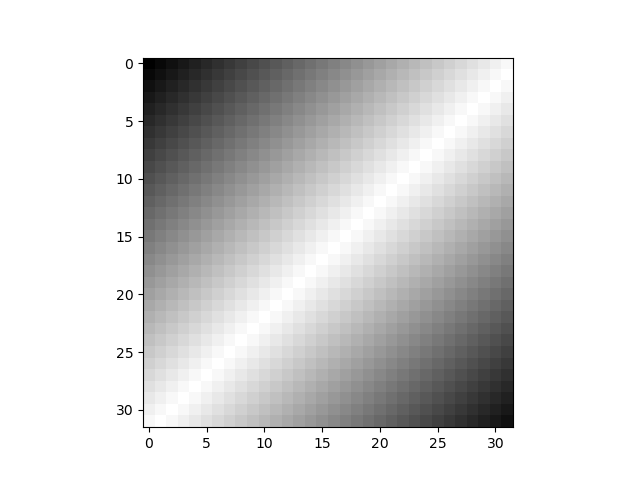
グレースケール
グレースケールの場合は、cmap='gray'を指定する。vmin、vmaxは省略しても同じ結果となるが念のため。
|
1 2 3 4 5 6 7 8 9 10 11 12 13 14 15 16 |
import numpy as np import matplotlib.pyplot as plt row_L = np.arange(0, 256, 8, dtype=int) row_R = np.arange(256, 0, -8) row = np.append(row_L, row_R) n_size = 256 // 8 image_array = np.empty((n_size, n_size), dtype=int) for r in range(n_size): image_array[r, :] = row[:n_size] row = np.roll(row, -1) plt.imshow(image_array, vmin=0, vmax=255, cmap='gray') plt.show() |
