概要
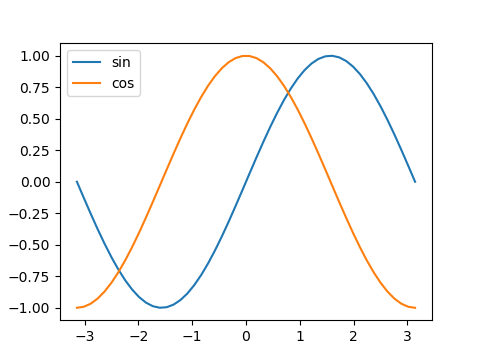
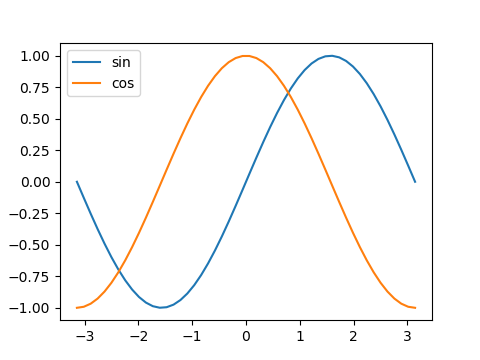
pyplotの各グラフに凡例を入れるには、legend()メソッドを使う。基本の使い方は以下の通り。
- plotやscatterなどでグラフを描く時の引数にlabel=”…”でラベルを定義する。ここで設定した文字列が凡例に使われる。
- グラフフィールドのオブジェクトのlegend()メソッドを実行する。
|
1 2 3 4 5 6 7 8 9 10 11 12 13 14 15 |
import numpy as np import matplotlib.pyplot as plt x = np.linspace(-np.pi, np.pi) s = np.sin(x) c = np.cos(x) fig, ax = plt.subplots(figsize=(4.8, 3.6)) ax.plot(x, s, label="sin") ax.plot(x, c, label="cos") ax.legend() plt.show() |
凡例の位置
標準的な位置指定
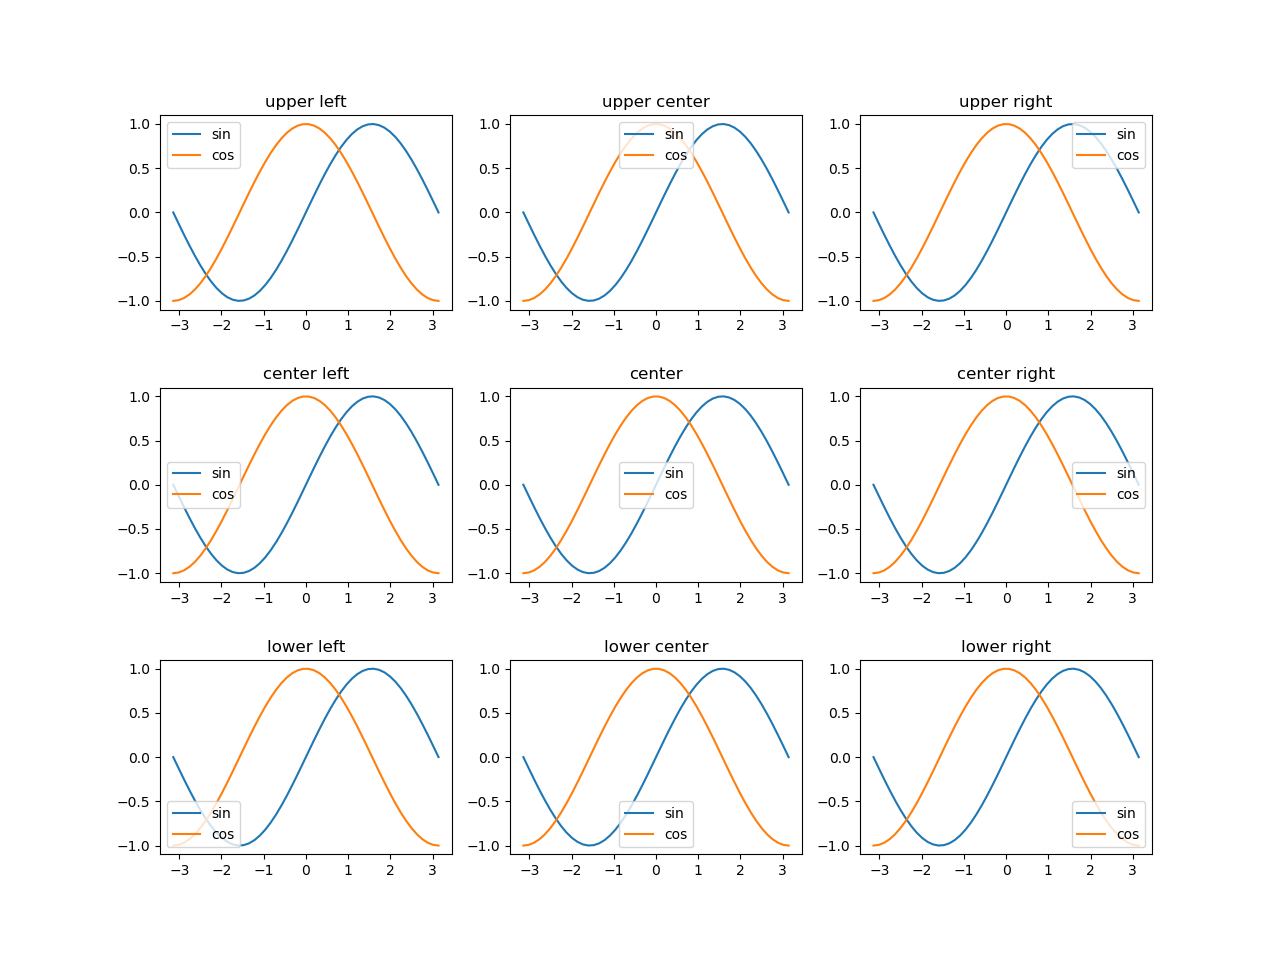
凡例の位置はloc引数に対して定義された文字列で指定する。
|
1 |
legend(loc='...') |
位置しての文字列は’[縦位置] [横位置]’で指定。
縦位置はupper, center, lowerの何れか、横位置はleft, center, rightの何れかで、縦位置と横位置の間には半角スペースを入れる(たとえば'upper right')。ただし縦横中心の場合は'center'。
デフォルトは'best'で最も適切な位置が自動で設定される。
|
1 2 3 4 5 6 7 8 9 10 11 12 13 14 15 16 17 18 19 20 21 22 23 24 25 26 27 28 29 30 |
import numpy as np import matplotlib.pyplot as plt x = np.linspace(-np.pi, np.pi) s = np.sin(x) c = np.cos(x) fig, axs = plt.subplots(3, 3, figsize=(12.8, 9.6)) plt.subplots_adjust(hspace=0.4) legends = np.empty((3, 3), dtype=object) legends[0, 0] = 'upper left' legends[0, 1] = 'upper center' legends[0, 2] = 'upper right' legends[1, 0] = 'center left' legends[1, 1] = 'center' legends[1, 2] = 'center right' legends[2, 0] = 'lower left' legends[2, 1] = 'lower center' legends[2, 2] = 'lower right' for row in range(3): for col in range(3): axs[row, col].set_title(legends[row, col]) axs[row, col].plot(x, s, label="sin") axs[row, col].plot(x, c, label="cos") axs[row, col].legend(loc=legends[row, col]) plt.show() |
bboxによる位置指定~凡例の外側への設置
Axes.legend()の位置指定で引数としてbbox_to_anchorを指定することで、グラフの描画領域の相対位置を細かく指定することもできる。
|
1 |
Axes.legend(bbox_to_anchor=(x, y), loc=location_str) |
bbox_to_anchor=(x, y)
- x, yはグラフ描画行きの左下を(0, 0)、右上を(1, 1)としたときの相対位置。ここで指定した位置と
locで指定した凡例の基準点を一致させる。
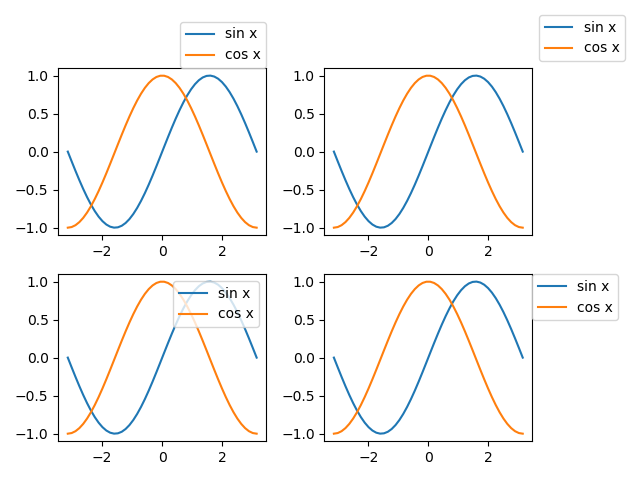
以下のコードは、全てbbox_to_anchor=(1, 1)として凡例を描画域の右上に合わせている。その上でlocで指定した凡例の位置がこの点と一致させられる。
たとえばloc="lower right"とすると凡例の左下の位置が描画域の右上と同じになるように配置される。また、標準では凡例の枠の周りに少しパディングが行われるが、borderaxespad引数で数値を指定することでその間隔を調整できる。
|
1 2 3 4 5 6 7 8 9 10 11 12 13 14 15 16 17 18 19 20 |
import numpy as np import matplotlib.pyplot as plt x = np.linspace(-np.pi, np.pi) ys = np.sin(x) yc = np.cos(x) fig, axes = plt.subplots(2, 2) ax_1d = axes.reshape(axes.size) for ax in ax_1d: ax.plot(x, ys, label="sin x") ax.plot(x, yc, label="cos x") ax_1d[0].legend(bbox_to_anchor=(1, 1), loc='lower right', borderaxespad=0) ax_1d[1].legend(bbox_to_anchor=(1, 1), loc='lower left') ax_1d[2].legend(bbox_to_anchor=(1, 1), loc='upper right') ax_1d[3].legend(bbox_to_anchor=(1, 1), loc='upper left', borderaxespad=0) plt.show() |
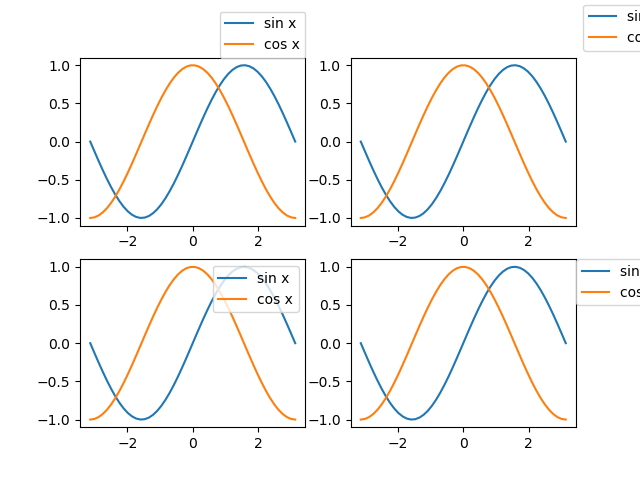
ただし、この例では凡例が画面の右側ではみ出て切れてしまっている。このようなときは、tightlayout()をFigureに対して実行することで描画領域に全体を収めることができる。
|
1 2 3 4 5 |
ax_1d[0].legend(bbox_to_anchor=(1, 1), loc='lower right', borderaxespad=0) ax_1d[1].legend(bbox_to_anchor=(1, 1), loc='lower left') ax_1d[2].legend(bbox_to_anchor=(1, 1), loc='upper right') ax_1d[3].legend(bbox_to_anchor=(1, 1), loc='upper left', borderaxespad=0) fig.tight_layout() |
凡例の並べ方
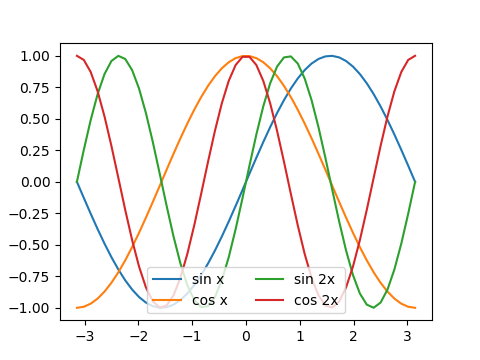
凡例はデフォルトでは縦に並べられるが、ncolに整数を指定して凡例の列数を指定できる。
|
1 |
legend(ncol=<em>n</em>) |
|
1 2 3 4 5 6 7 8 9 10 11 12 13 14 15 16 17 18 19 |
import numpy as np import matplotlib.pyplot as plt x = np.linspace(-np.pi, np.pi) s1 = np.sin(x) c1 = np.cos(x) s2 = np.sin(x * 2) c2 = np.cos(x * 2) fig, ax = plt.subplots(figsize=(4.8, 3.6)) ax.plot(x, s1, label="sin x") ax.plot(x, c1, label="cos x") ax.plot(x, s2, label="sin 2x") ax.plot(x, c2, label="cos 2x") ax.legend(ncol=2, loc='lower center') plt.show() |
デザイン等
このほか、デザイン関連で以下のような引数がある
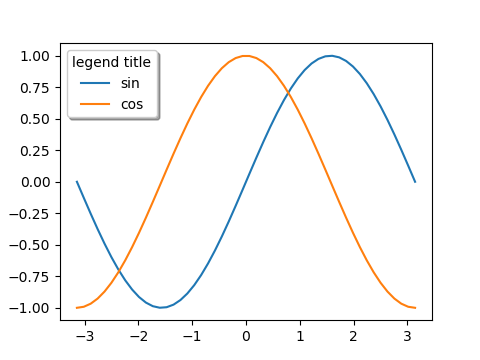
- title=[文字列]
- 凡例内にタイトルを設定。
- fancybox=False/True
- Trueを指定すると凡例の枠の角が丸くなる。
- shadow=False/True
- Trueを指定すると凡例に影がつけられる。
|
1 2 3 4 5 6 7 8 9 10 11 12 13 14 15 |
import numpy as np import matplotlib.pyplot as plt x = np.linspace(-np.pi, np.pi) s = np.sin(x) c = np.cos(x) fig, ax = plt.subplots(figsize=(4.8, 3.6)) ax.plot(x, s, label="sin") ax.plot(x, c, label="cos") ax.legend(title="legend title", fancybox=True, shadow=True) plt.show() |
凡例の文字サイズ
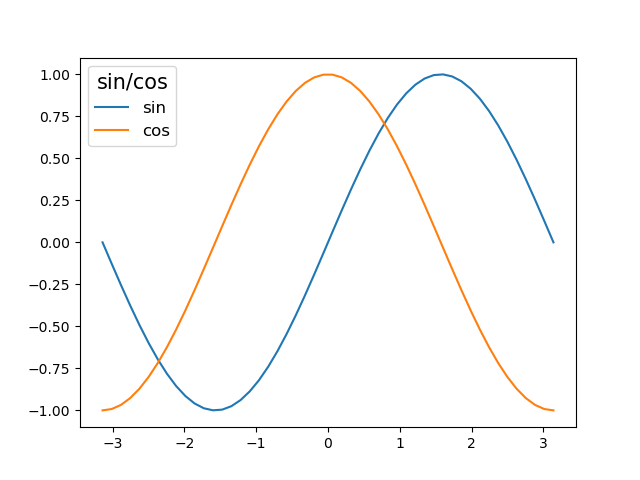
凡例本体の文字サイズは、legend()の引数fontsizeで指定する。
凡例のタイトルの文字サイズは、凡例オブジェクトからget_title()でタイトルオブジェクトを取得し、set_fontsize()で設定する。
|
1 2 3 4 5 6 7 8 9 10 11 12 13 14 15 16 |
import numpy as np import matplotlib.pyplot as plt x = np.linspace(-np.pi, np.pi) y_sin = np.sin(x) y_cos = np.cos(x) fig, ax = plt.subplots() ax.plot(x, y_sin, label="sin") ax.plot(x, y_cos, label="cos") lg = ax.legend(title="sin/cos", fontsize=12) lg.get_title().set_fontsize(15) plt.show() |
この2行の手続きは、以下のようにチェインによって1行で書くこともできる。
|
1 |
ax.legend(title="sin/cos", fontsize=12).get_title().set_fontsize(15) |
引数handles、labels
legend(handles, labels)という指定方法。公式ドキュメントではこちらが先に示されている。
Axes.get_legend_handles_labels()の戻り値として、グラフ要素のhandleとそれに対するlabelのリストが得られる。
この方法は、後述のように複数のグラフの凡例をまとめて扱うときに利用する。
|
1 2 3 4 5 6 7 8 9 10 11 12 13 14 15 16 17 18 19 20 21 22 |
import numpy as np import matplotlib.pyplot as plt x = np.linspace(-np.pi, np.pi) s = np.sin(x) c = np.cos(x) fig, ax = plt.subplots(figsize=(4.8, 3.6)) ax.plot(x, s, label="sin") ax.plot(x, c, label="cos") handles, labels = ax.get_legend_handles_labels() ax.legend(handles, labels) print(handles) print(labels) plt.show() # [<matplotlib.lines.Line2D object at 0x142220F0>, <matplotlib.lines.Line2D object at 0x14222370>] # ['sin', 'cos'] |
複数グラフの場合の凡例
複数のAxesのグラフの凡例を1つにまとめて表示したい場合は、それぞれのAxesでhandleとlabelを取得しておき、それらを結合してlegend()の引数とする。
|
1 2 3 4 5 6 7 8 9 10 11 12 13 14 15 16 17 18 19 |
import numpy as np import numpy.random as rnd import matplotlib.pyplot as plt x = np.linspace(-np.pi, np.pi) sn = np.sin(x) cs = np.cos(x) fig, axs = plt.subplots(1, 2, figsize=(8, 3.6)) axs[0].plot(sn, c='b', label="sin x") handles0, labels0 = axs[0].get_legend_handles_labels() axs[1].plot(cs, c='r', label="cos x") handles1, labels1 = axs[1].get_legend_handles_labels() axs[0].legend(handles0 + handles1, labels0 + labels1) plt.show() |
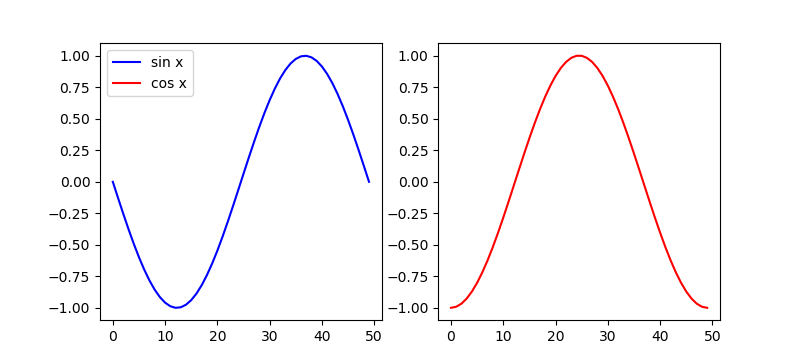
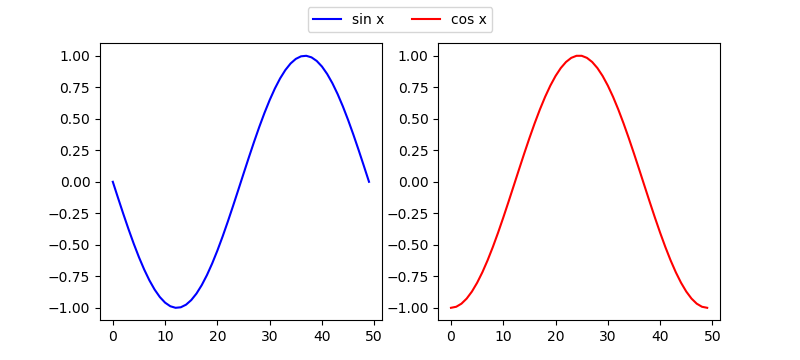
上の方法だと特定のAxesに凡例が表示されるが、これをまとめたいときには、figureに凡例を表示させる。
|
1 2 3 4 5 6 7 8 9 10 11 12 13 14 15 16 17 18 19 |
import numpy as np import numpy.random as rnd import matplotlib.pyplot as plt x = np.linspace(-np.pi, np.pi) sn = np.sin(x) cs = np.cos(x) fig, axs = plt.subplots(1, 2, figsize=(8, 3.6)) axs[0].plot(sn, c='b', label="sin x") handles0, labels0 = axs[0].get_legend_handles_labels() axs[1].plot(cs, c='r', label="cos x") handles1, labels1 = axs[1].get_legend_handles_labels() fig.legend(handles0 + handles1, labels0 + labels1, ncol=2, loc='upper center') plt.show() |
