subplot間の間隔調整
Figure内のSubplotの位置や相互の間隔を調整するには、subplots_adjust()メソッドを用いる。pyplot.subplots_adjust()でもよいが、figureのメソッドとしてもよい。
pyplot.subplots_adjust(left, bottom, right, top, wspace, hspace)left, bottom, right, topはsubplots全体の左端、下端、右端、上端の位置。wspace, hspaceはそれぞれ各subplot間の幅方向と高さ方向の間隔。
引数の意味はドキュメントで以下のように説明されている。
|
1 2 3 4 5 6 7 8 |
left = 0.125 # the left side of the subplots of the figure right = 0.9 # the right side of the subplots of the figure bottom = 0.1 # the bottom of the subplots of the figure top = 0.9 # the top of the subplots of the figure wspace = 0.2 # the amount of width reserved for space between subplots, # expressed as a fraction of the average axis width hspace = 0.2 # the amount of height reserved for space between subplots, # expressed as a fraction of the average axis height |
left~topはキャンバスの左上を(0, 0)、右下を(1, 1)としたときの比率。
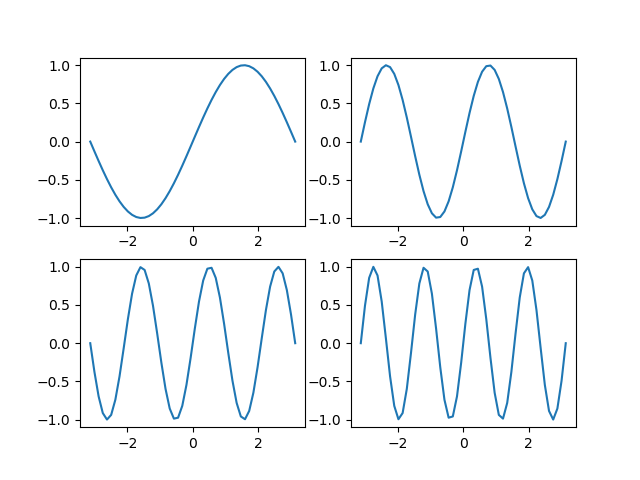
たとえばデフォルトで4つのsubpotsを描く。
|
1 2 3 4 5 6 7 8 9 10 11 12 |
import numpy as np import matplotlib.pyplot as plt fig, axs = plt.subplots(2, 2) x = np.linspace(-np.pi, np.pi) for n, ax in enumerate(axs.reshape(axs.size)): ax.plot(x, np.sin(x * (n + 1))) fig.subplots_adjust() plt.show() |

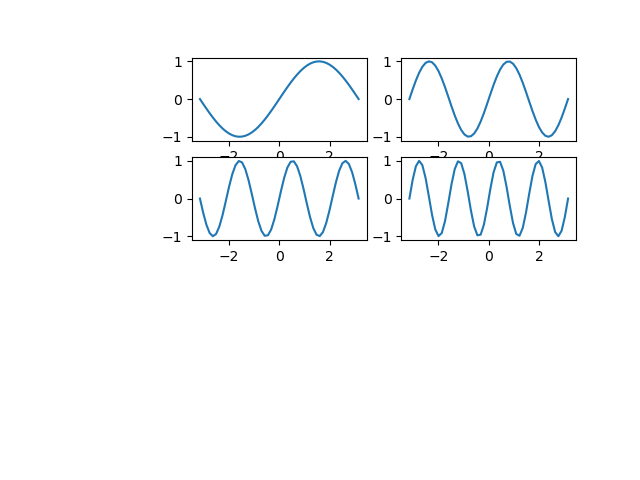
これに対してsubplots全体の左端をキャンバス内の左から0.3の位置に、下端を下から0.5の位置に設定すると以下のようになる。
|
1 |
fig.subplots_adjust(left=0.3, bottom=0.5) |

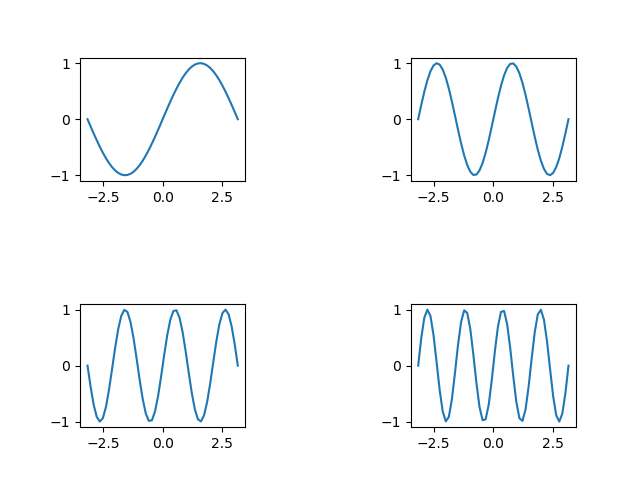
また、wspace、hspaceを1とすると以下のようになる。
|
1 |
fig.subplots_adjust(wspace=1, hspace=1) |
