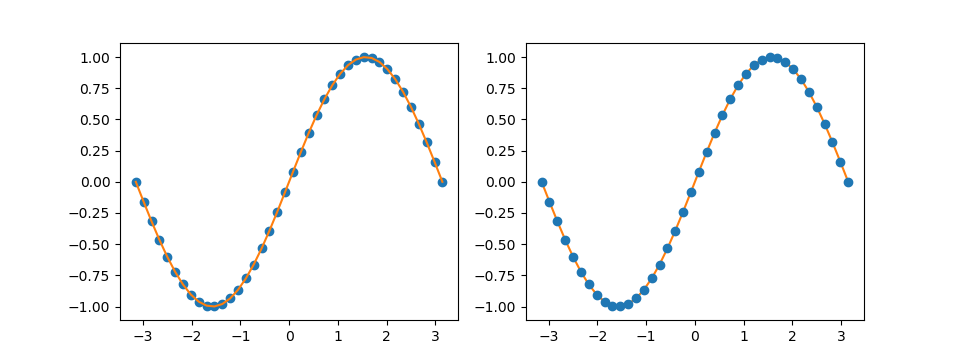
pyplotでグラフを描画する際、点よりも線の方が上になって見栄えが悪い・・・といった場合に、どのグラフから上にするかという指定が必要になる。
グラフ描画の優先性はplot()やscatter()などのグラフメソッドの引数にzorderを指定して実現できる。zorderに指定した値がより大きいグラフの方が上のレイヤーになる。指定できる値は正負の実数。
|
1 2 3 4 5 6 7 8 9 10 11 12 13 14 15 |
import numpy as np import matplotlib.pyplot as plt fig, ax = plt.subplots(1, 2, figsize=(9.6, 3.6)) x = np.linspace(-np.pi, np.pi, 40) y = np.sin(x) ax[0].plot(x, y, color='tab:orange') ax[0].scatter(x, y, color='tab:blue') ax[1].plot(x, y, zorder=-0.1, color='tab:orange') ax[1].scatter(x, y, zorder=1, color='tab:blue') plt.show() |

左のグラフは後から実行しているscatterがplotの下に表示されている。
右のグラフではzorderを指定しており、scatterの方が値が大きいため上のレイヤーに表示されている。