概要
Pythonのmatplotlibにはanimationパッケージがあり、ArtistAnimationとFuncAnimationの2つのクラスが準備されている。
ArtistAnimationは、予め動画に表示する各フレームを生成しておいて、これらを動画として表示するFuncAnimationは、全結果を保存せず、フレームごとに描画を実行する関数を実行して、動画して表示する
ここでは、FuncAnimationによる動画の表示方法を整理する(ArtistAnimationについてはこちら)。
1つのグラフの表示
流れ
animationパッケージ又はArtistAnimationクラスをインポート- グラフを描画する関数を定義
FuncAnimationクラスのコンストラクターに描画関数を渡してインスタンスを生成- 表示
処理ステップ
インポート
パッケージをインポートする
|
1 2 |
from matplotlib.animation import FuncAnimation # この場合はFuncAnimation(...)と直接コンストラクターを呼ぶ |
または
|
1 2 |
import matplotlib.animation as animation # この場合はanimation.FuncAnimation(...)のようにコンストラクターを呼ぶ |
フレームリストの準備
動画の各フレームを保存するリストを準備する。animationパッケージでは、個々のグラフフレームをartistと表現している。
|
1 |
artists = [] |
FigureとAxesオブジェクトを準備
フレームを描画するオブジェクトを準備しておく
|
1 |
fig, ax = plt.subplots() |
1フレームを描画する関数を定義
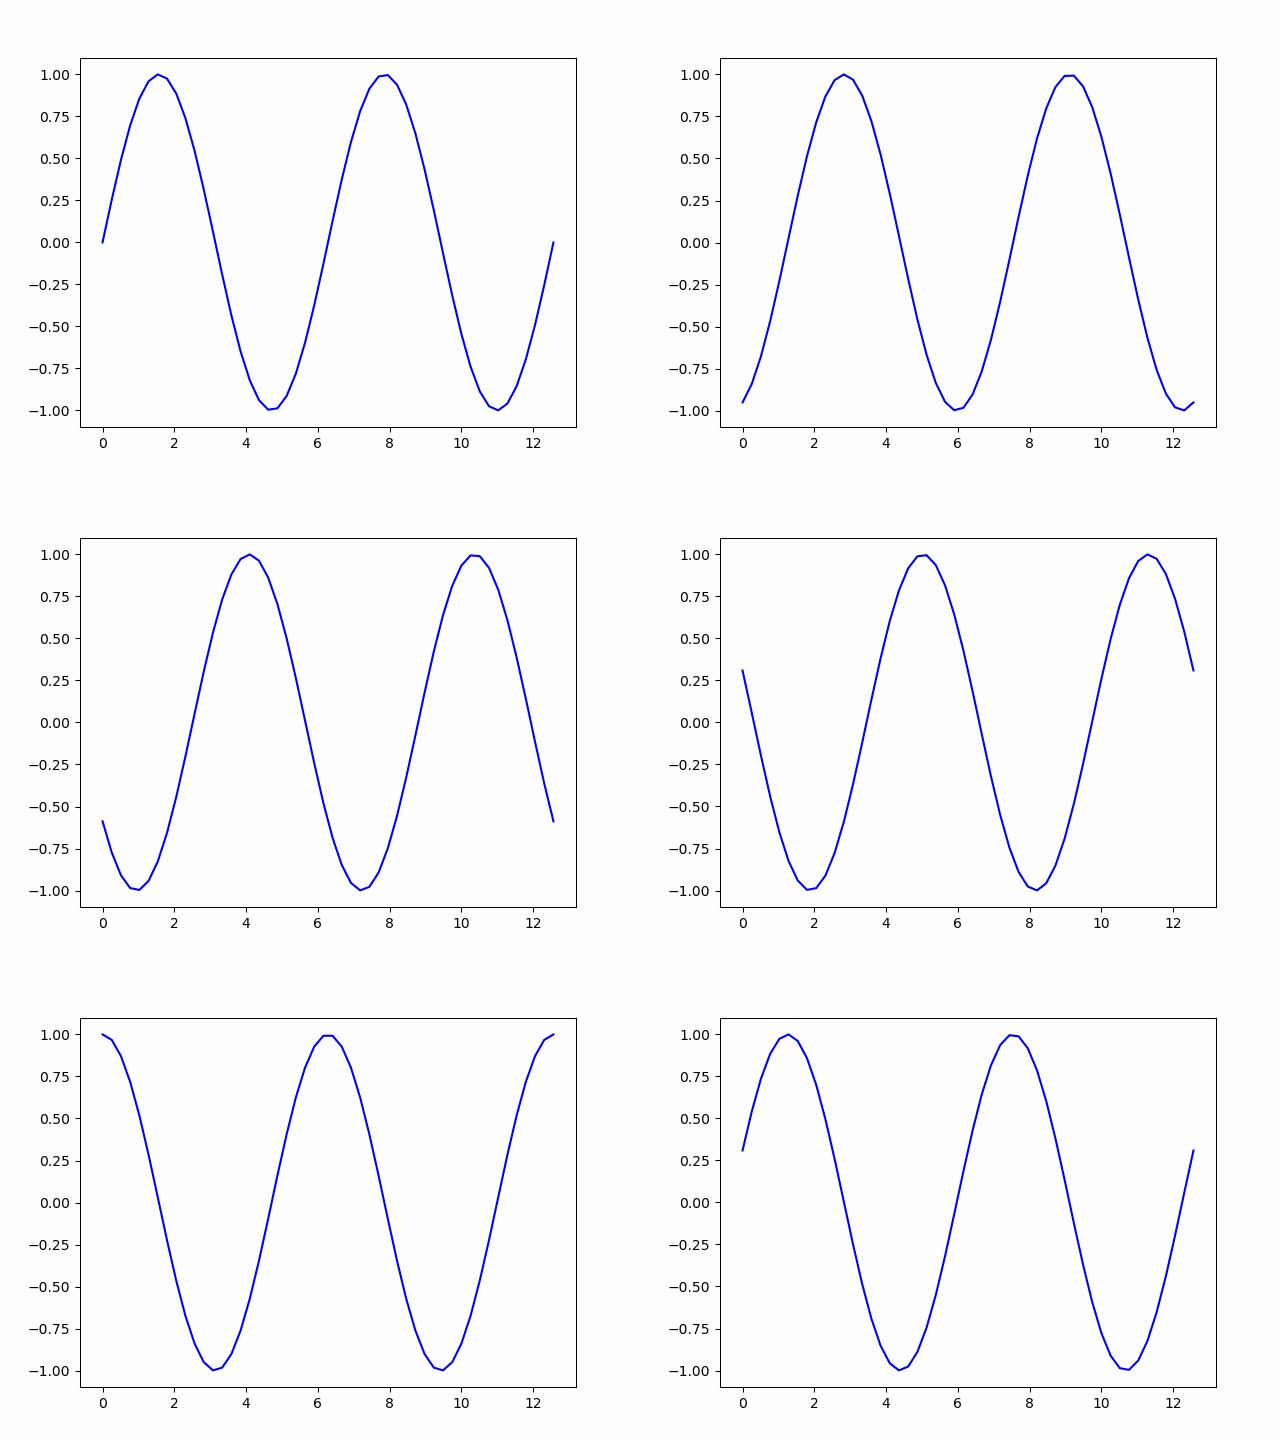
4周期分の正弦関数を描画する関数を定義している。
|
1 2 3 4 5 |
def draw_frame(frame): plt.cla() x = np.linspace(0, 4 * np.pi) y = np.sin(x - frame / frame_count * 2 * np.pi) ax.plot(x, y, color='blue') |
- ここではループごとに
xを計算しているが、今回は全フレーム共通なので、ループの外で準備してもよい plot命令のcolor指定をしないと、描画するごとに違うグラフとして色を変えて描画されてしまう
アニメーション設定して表示させる
FuncAnimationクラスのコンストラクターに必要な引数を与えてインスタンスを生成し、表示させる。intervalはフレーム間の待機時間で、ミリ秒で与える。
|
1 2 3 |
arim = ArtistAnimation(fig, artists, interval=100) plt.show() |
GIF画像として保存する
結果をGIF画像として保存するには、plt.show()を実行せず、以下のようにimagemagicでファイルとして書き出す。
frames=20でフレーム数を設定しているが、これがないとGIF保存のときにファイル容量が肥大化してしまう。それでも容量は800KB程度になり、ArtistAnimationのときの150KB程度よりも大きい。
|
1 2 3 |
anim = FuncAnimation(fig, draw_frame, interval=100, frames=20) plt.show() |
実行結果
以下のような動画が表示される。

コード
全体の実行コードは以下のとおり。
|
1 2 3 4 5 6 7 8 9 10 11 12 13 14 15 16 17 18 19 20 21 22 23 |
import numpy as np import matplotlib.pyplot as plt from matplotlib.animation import FuncAnimation # 各フレームを保存するフレームリスト frame_count = 20 # FigureとAxesインスタンスを取得 fig, ax = plt.subplots() # 表示する各フレームを生成する関数 def draw_frame(frame): plt.cla() x = np.linspace(0, 4 * np.pi) y = np.sin(x - frame / frame_count * 2 * np.pi) ax.plot(x, y, color='blue') # 描画関数を渡してFuncAnimationインスタンスを生成 anim = FuncAnimation(fig, draw_frame, interval=100, frames=20) # 表示 plt.show() #anim.save("simple.gif", writer="imagemagick") |
複数のグラフの表示
流れ
全体の流れは単一のグラフの場合と同じ。リスト保存時に複数グラフを加算して重ね合わせるところだけが異なる。
animationパッケージ又はArtistAnimationクラスをインポート- グラフを描画する関数を定義し、複数のグラフをプロット
FuncAnimationクラスのコンストラクターに描画関数を渡してインスタンスを生成- 表示
処理ステップ
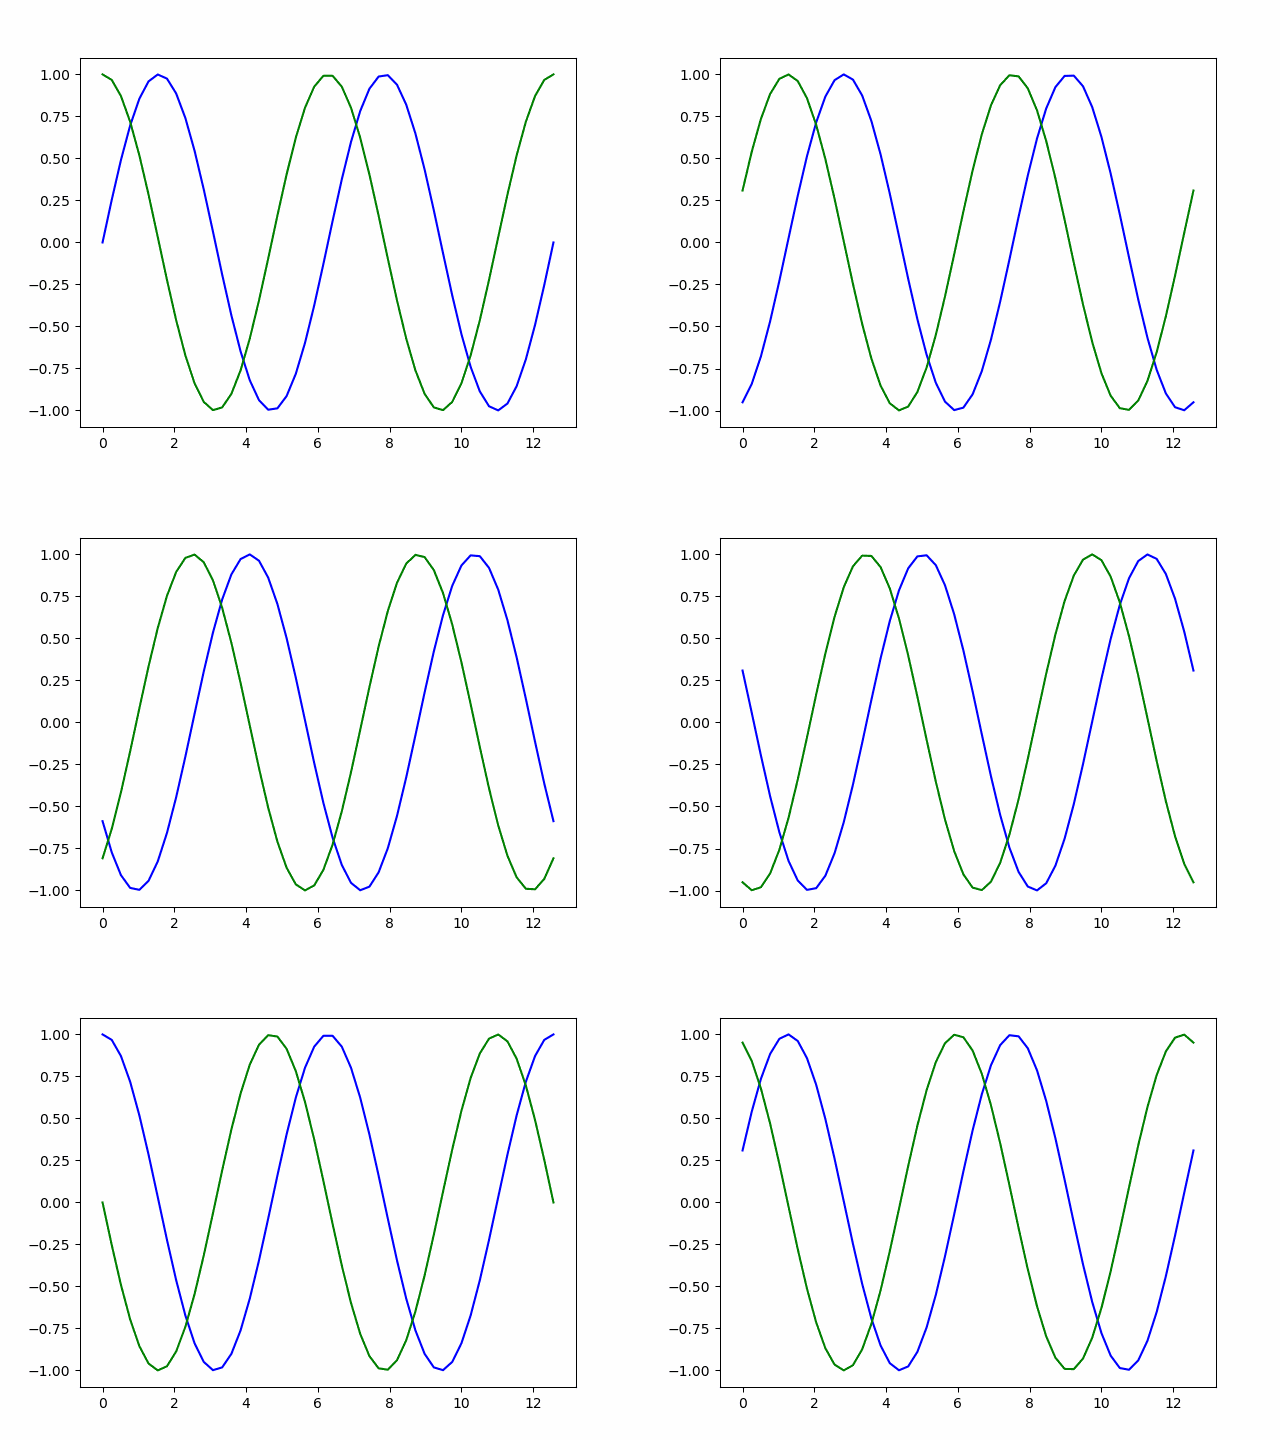
以下の描画関数が単一グラフの場合と異なる。関数の中で、異なる2つのグラフを描画している
|
1 2 3 4 5 6 7 |
def draw_frame(frame): x = np.linspace(0, 4 * np.pi) plt.cla() y1 = np.sin(x - frame / frame_count * 2 * np.pi) y2 = np.sin(x - frame / frame_count * 2 * np.pi + np.pi / 2) ax.plot(x, y1, color='blue') ax.plot(x, y2, color='green') |
実行結果
以下のように、2つのグラフが同時に表示される。

コード
全体の実行コードは以下のとおり。
|
1 2 3 4 5 6 7 8 9 10 11 12 13 14 15 16 17 18 19 20 21 22 23 24 25 |
import numpy as np import matplotlib.pyplot as plt from matplotlib.animation import FuncAnimation # 各フレームを保存するフレームリスト frame_count = 20 # FigureとAxesインスタンスを取得 fig, ax = plt.subplots() # 表示する各フレームを生成する関数 def draw_frame(frame): x = np.linspace(0, 4 * np.pi) plt.cla() y1 = np.sin(x - frame / frame_count * 2 * np.pi) y2 = np.sin(x - frame / frame_count * 2 * np.pi + np.pi / 2) ax.plot(x, y1, color='blue') ax.plot(x, y2, color='green') # 描画関数を渡してFuncAnimationインスタンスを生成 anim = FuncAnimation(fig, draw_frame, interval=100, frames=20) # 表示 plt.show() #anim.save("multi.gif", writer="imagemagick") |
描画関数に引数を渡す
描画関数に独自の引数を渡すことができる。
たとえば最初の「1つのグラフの表示」で、frame_countと表示する最大時刻max_xを引数とする場合、まず描画関数でこれらを引数として宣言し、関数内でこれを使った処理を書く。
|
1 2 3 4 5 |
def draw_frame(frame, max_x, frame_count): plt.cla() x = np.linspace(0, max_x) y = np.sin(x - frame / frame_count * 2 * np.pi) ax.plot(x, y, color='blue') |
FuncAnimationインスタンス生成時に、fargsで独自宣言した引数の値をタプルで与える。
|
1 |
anim = FuncAnimation(fig, draw_frame, fargs=(4 * np.pi, 20), interval=100, frames=20) |