概要
irisデータセットにscikit-learnのKNeighborsClassifierクラスでk-最近傍法を適用した結果。
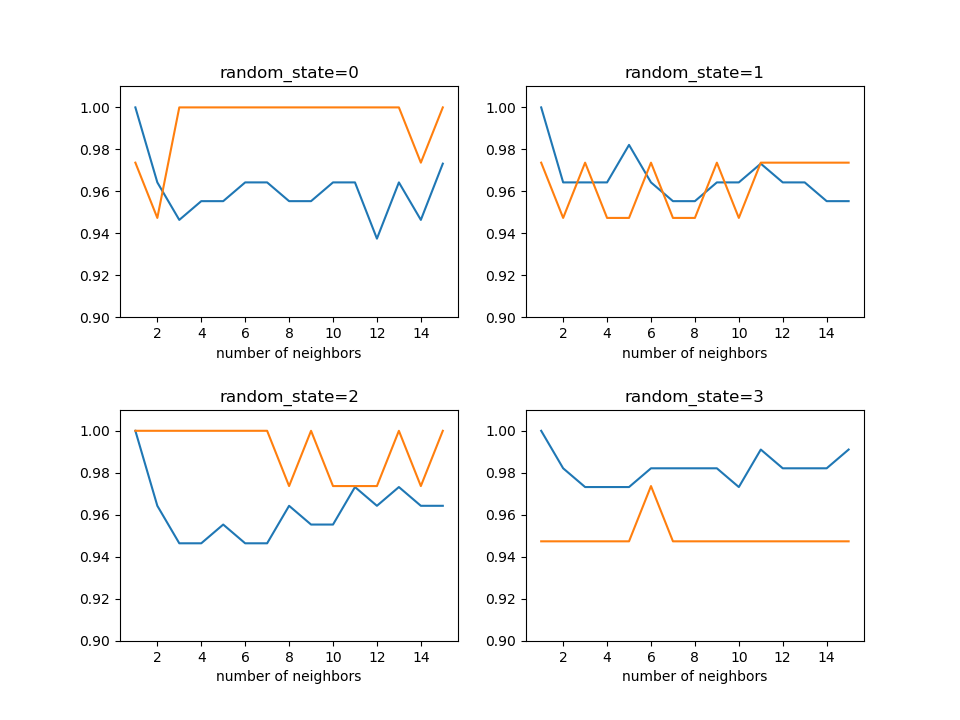
学習率曲線
irisデータセットにk-最近傍法を適用し、近傍点数を変化させて学習率の変化をチェック。データセットを学習データとテストデータに分けるときのrandom_stateを変え、近傍点数に伴う変化を見てみた。
レコード数が150と少ないこともあって、random_stateを変えるごとにかなり推移が異なるが、概ね95%の精度が保たれている。
|
1 2 3 4 5 6 7 8 9 10 11 12 13 14 15 16 17 18 19 20 21 22 23 24 25 26 27 28 29 30 31 32 33 34 35 36 37 38 39 40 41 42 43 44 45 46 47 48 49 50 51 |
import numpy as np import matplotlib.pyplot as plt from sklearn.datasets import load_iris from sklearn.model_selection import train_test_split from sklearn.neighbors import KNeighborsClassifier def train_and_test(X, y, n_neighbors_list, random_state): X_train, X_test, y_train, y_test =\ train_test_split(X, y, stratify=y, random_state=random_state) training_scores = [] test_scores = [] for n_neighbors in n_neighbors_list: classifier = KNeighborsClassifier(n_neighbors=n_neighbors) classifier.fit(X_train, y_train) training_scores.append(classifier.score(X_train, y_train)) test_scores.append(classifier.score(X_test, y_test)) return training_scores, test_scores iris_ds = load_iris() X = iris_ds.data y = iris_ds.target n_neighbors_list = np.arange(1, 16, dtype=int) random_state_list = np.array([0, 1, 2, 3]) fig, axs = plt.subplots(2, 2, figsize=(9.6, 7.2)) plt.subplots_adjust(hspace=0.4) axs_1d = axs.reshape(1, -1)[0] # random_stateを変化させて学習率の違いを見る for ax, random_state in zip(axs_1d, random_state_list): training_scores, test_scores =\ train_and_test(X, y, n_neighbors_list, random_state) ax.plot(n_neighbors_list, training_scores) ax.plot(n_neighbors_list, test_scores) ax.set_title("random_state={}".format(random_state)) ax.set_xlabel("number of neighbors") ax.set_ylim(0.9, 1.01) plt.show() |