概要
Boston house pricesデータセットは、持家の価格とその持家が属する地域に関する指標からなるデータセットで、多変量の特徴量から属性値を予想するモデルに使われる。
各特徴量の分布
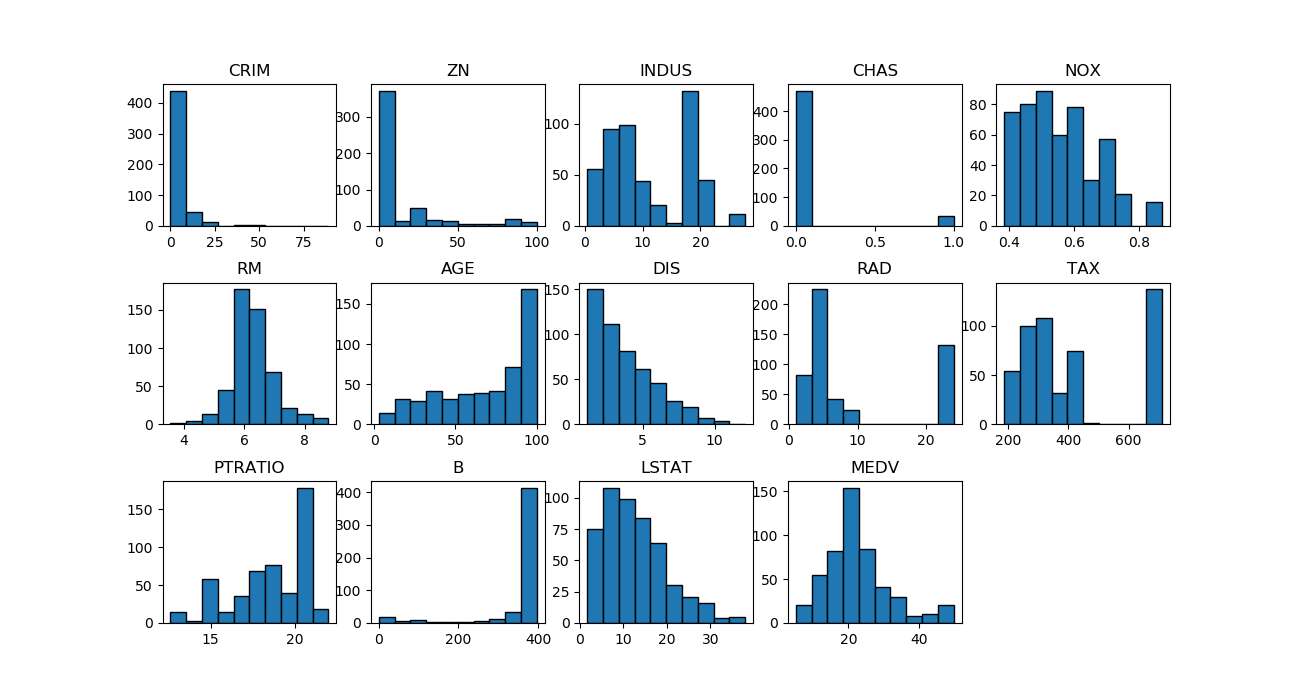
データセットからBostonにおける506の地域における13の特徴量と住宅価格の中央値が得られるが、それぞれ単独の分布を見ておく。最後のMEDVは持家価格(1000ドル単位)の中央値(Median Value)。
特徴量CHASはチャールズ川の川沿いに立地しているか否かのダミー変数で、0/1の2通りの値を持つ。いくつかの特徴量は値が集中していたり、離れたところのデータが多かったりしている。

|
1 2 3 4 5 6 7 8 9 10 11 12 13 14 15 16 17 18 19 20 21 22 23 24 25 |
import matplotlib.pyplot as plt from sklearn.datasets import load_boston boston_ds = load_boston() X = boston_ds.data y = boston_ds.target feature_names = boston_ds.feature_names n_features = X.shape[1] fig, axs = plt.subplots(3, 5, figsize=(13, 7)) plt.subplots_adjust(hspace=0.4) axs_1d = axs.reshape(1, -11)[0] for ax, nf in zip(axs_1d, range(n_features)): ax.hist(X[:, nf], ec='k') ax.set_title(feature_names[nf]) axs_1d[n_features].hist(y, ec='k') axs_1d[n_features].set_title("MEDV") axs_1d[-1].axis('off') plt.show() |
各特徴量と価格の関係
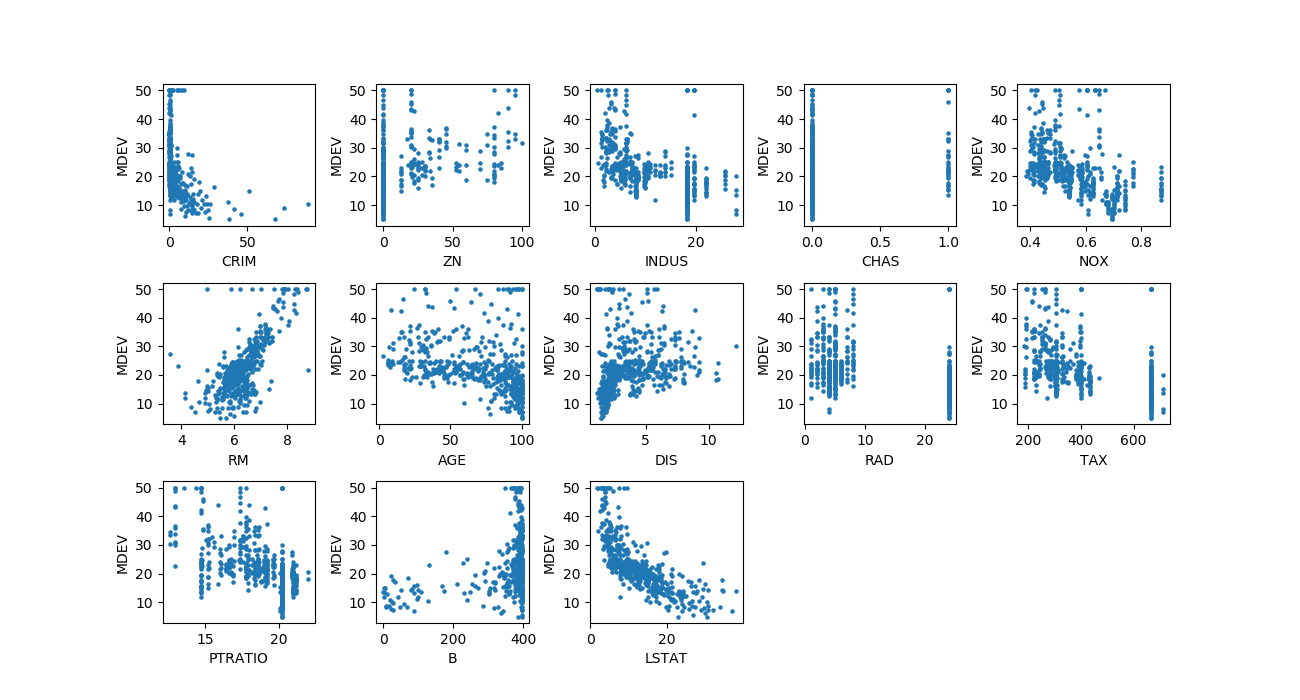
13の特徴量1つ1つと価格の関係を散布図で見てみる。
比較的明らかな関係がみられるのはRM(1戸あたり部屋数)とLATAT(下位層の人口比率)で、この2つは特徴量自体の分布が比較的”整っている”。
NOX(NOx濃度)も特徴量の分布はそこそこなだらかだが、散布図では強い相関とは言い難い。
AGE(古い物件の比率)とDIS(職業紹介所への距離)はそれぞれ分布が単調減少/単調増加で、特徴量の大小と価格の高低の関係はある程度予想通りだがかなりばらついている。いずれの指標についてもMDEVがある値以下で密度が高くなっているように見えるのは興味深い。

|
1 2 3 4 5 6 7 8 9 10 11 12 13 14 15 16 17 18 19 20 21 22 23 24 |
import matplotlib.pyplot as plt from sklearn.datasets import load_boston boston_ds = load_boston() X = boston_ds.data target = boston_ds.target feature_names = boston_ds.feature_names n_features = X.shape[1] fig, axs = plt.subplots(3, 5, figsize=(13, 7)) fig.subplots_adjust(hspace=0.4, wspace=0.4) axs_1d = axs.reshape(1, -1)[0] for ax, nf in zip(axs_1d, range(n_features)): ax.scatter(X[:, nf], target, s=5) ax.set_xlabel(feature_names[nf]) ax.set_ylabel("MDEV") for i in range(-2, 0): axs_1d[i].axis('off') plt.show() |
2つの特徴量と価格の関係
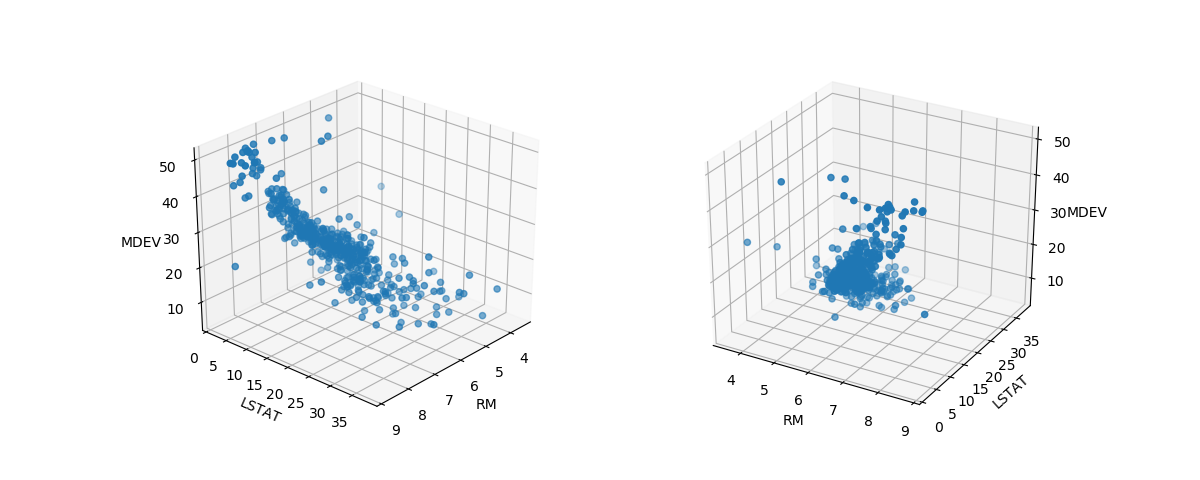
個々の特徴量ごとの、価格との相関がある程度が明確だったRMとLSTATについて価格との関係を3次元で見てみる。
それぞれの相関がある程度明確なので、3次元でも一つの帯のようになっている。
|
1 2 3 4 5 6 7 8 9 10 11 12 13 14 15 16 17 18 19 20 21 22 23 24 25 26 27 28 |
import numpy as np import pandas as pd import matplotlib.pyplot as plt from mpl_toolkits.mplot3d import Axes3D from sklearn.datasets import load_boston boston_ds = load_boston() X_df = pd.DataFrame(boston_ds.data, columns=boston_ds.feature_names) x = np.array(X_df['RM']) y = np.array(X_df['LSTAT']) z = boston_ds.target fig = plt.figure(figsize=(12, 4.8)) ax1 = fig.add_subplot(121, projection='3d') ax1.scatter(x, y, z) ax1.set_xlabel("RM") ax1.set_ylabel("LSTAT") ax1.set_zlabel("MDEV") ax2 = fig.add_subplot(122, projection='3d') ax2.scatter(x, y, z) ax2.set_xlabel("RM") ax2.set_ylabel("LSTAT") ax2.set_zlabel("MDEV") plt.show() |
