過学習?
書籍”Pythonではじめる機械学習”の”2.3.7.4 SVMパラメータの調整”の最後の方で、scikit-learnのSVMをBreast Cancerデータセットに適用した例が示されている(カーネル法によるSVMについてはこちらにまとめている)。
|
1 2 3 4 5 6 7 8 9 10 11 12 13 14 15 16 17 18 |
import numpy as np import matplotlib.pyplot as plt from sklearn.datasets import load_breast_cancer from sklearn.model_selection import train_test_split from sklearn.svm import SVC ds = load_breast_cancer() X, y = ds.data, ds.target X_train, X_test, y_train, y_test = train_test_split(X, y, random_state=0) svc = SVC(gamma='auto').fit(X_train, y_train) print("Training score: {:.3f}".format(svc.score(X_train, y_train))) print("Test score : {:.3f}".format(svc.score(X_test, y_test))) # Training score: 1.000 # Test score : 0.629 |
ここで、原典ではSVC()の引数を指定せずデフォルトのままとしているが、そのまま実行すると以下のような結果になった。
|
1 2 |
Training score: 0.904 Test score : 0.937 |
scikit-learnのドキュメンテーションによると、
Kernel coefficient for ‘rbf’, ‘poly’ and ‘sigmoid’.
- if
gamma='scale'(default) is passed then it uses 1 / (n_features * X.var()) as value of gamma, - if ‘auto’, uses 1 / n_features.
Changed in version 0.22: The default value of gamma changed from ‘auto’ to ‘scale’.
とされていて、gammaのデフォルト設定が変わったようである。新しい仕様ではデフォルトでデータのスケーリングが行われるため、どちらかといえば適合不足の状態になる。先のコードでは明示的にgamma=autoを設定し、書籍と同じ結果を得ている。
特徴量データのサイズの違い
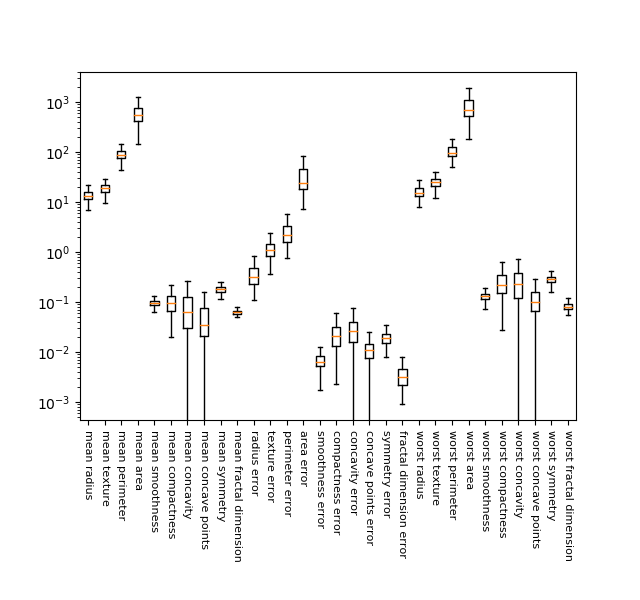
Breast Cancerデータの30の特徴量について、各々の分布状況を箱髭図で描いてみた。縦軸の対数スケールに対してでも、各特徴量がかなりばらついており、1万倍~100万倍ほどの違いがあることがわかる。

|
1 2 3 4 5 6 7 8 9 10 11 12 13 14 15 16 17 |
import matplotlib.pyplot as plt from sklearn.datasets import load_breast_cancer from sklearn.model_selection import train_test_split ds = load_breast_cancer() X, y = ds.data, ds.target X_train, X_test, y_train, y_test = train_test_split(X, y, random_state=0) fig, ax = plt.subplots(figsize=(6.4, 6)) fig.subplots_adjust(bottom=0.3) ax.boxplot(X_train, showfliers=False) ax.set_xticklabels(ds.feature_names, rotation=270, fontsize=8) ax.set_yscale('log') plt.show() |
データの前処理
データのスケールを揃えるために使われるMiniMaxScalorでは、各特徴量の訓練データを最小値と最大値でスケーリングし、0~1に納まるようにする。具体的には、特徴量ごとに最小値を引いて、最大値-最小値のレンジで除する。
|
1 2 3 4 5 6 7 8 9 10 11 12 13 14 15 16 17 18 19 20 21 22 |
from sklearn.datasets import load_breast_cancer from sklearn.model_selection import train_test_split from sklearn.svm import SVC ds = load_breast_cancer() X, y = ds.data, ds.target X_train, X_test, y_train, y_test = train_test_split(X, y, random_state=0) min_features = X_train.min(axis=0) max_features = X_train.max(axis=0) ranges = max_features - min_features X_train_scaled = (X_train - min_features) / ranges print("Scaled training data:") print("Minimum for each feature\n{}".format(X_train_scaled.min(axis=0))) print("Maximum for each feature\n{}".format(X_train_scaled.max(axis=0))) print() X_test_scaled = (X_test - min_features) / ranges print("Scaled test data:") print("Minimum for each feature\n{}".format(X_test_scaled.min(axis=0))) print("Maximum for each feature\n{}".format(X_test_scaled.max(axis=0))) |
この結果、訓練データの各特徴量の最小値はすべて0となり、最大値はすべて1となる。
|
1 2 3 4 5 6 7 |
Scaled training data: Minimum for each feature [0. 0. 0. 0. 0. 0. 0. 0. 0. 0. 0. 0. 0. 0. 0. 0. 0. 0. 0. 0. 0. 0. 0. 0. 0. 0. 0. 0. 0. 0.] Maximum for each feature [1. 1. 1. 1. 1. 1. 1. 1. 1. 1. 1. 1. 1. 1. 1. 1. 1. 1. 1. 1. 1. 1. 1. 1. 1. 1. 1. 1. 1. 1.] |
テストデータに対してもスケーリングを行うが、ここで使う最小値とレンジは訓練データのものとし、訓練データとテストデータでスケーリングに歪がでないようにする。その結果、スケーリング後のテストデータには、最小値が0より小さい値や最大値が1より大きい値が出ている。
|
1 2 3 4 5 6 7 8 9 10 11 12 13 |
Scaled test data: Minimum for each feature [ 0.03540158 0.04190871 0.02895446 0.01497349 0.14260888 0.04999658 0. 0. 0.07222222 0.00589722 0.00105015 -0.00057494 0.00067851 -0.0007963 0.05148726 0.01434497 0. 0. 0.04195752 0.01113138 0.03678406 0.01252665 0.03366702 0.01400904 0.08531995 0.01833687 0. 0. 0.00749064 0.02367834] Maximum for each feature [0.76809125 1.22697095 0.75813696 0.64750795 1.20310633 1.11643038 0.99906279 0.90606362 0.93232323 0.94903117 0.45573058 0.72623944 0.48593507 0.31641282 1.36082713 1.2784499 0.36313131 0.77476795 1.32643996 0.72672498 0.82106012 0.87553305 0.77887345 0.67803775 0.78603975 0.87843331 0.93450479 1.0024113 0.76384782 0.58743277] |
スケーリングされた訓練データとテストデータについてスコアを計算すると以下のようになり、先ほどの過学習の状態から適合不足の状態となった。尚この結果は、新しいSVCクラスにおいてデフォルトのgamma='auto'を指定したときの傾向と似ていて、若干の適合不足となっている。
|
1 2 3 4 5 6 7 |
svc = SVC(gamma='auto').fit(X_train_scaled, y_train) print("Training score:{:.3f}".format(svc.score(X_train_scaled, y_train))) print("Test score :{:.3f}".format(svc.score(X_test_scaled, y_test))) # Training score:0.948 # Test score :0.951 |
パラメーター調整
上記の適合不足の結果に対して、パラメーターを変化させてみる。デフォルトのC=1からC=1000としてみると、訓練スコア、テストスコアとも改善された。テストスコアはランダムフォレストや決定木の勾配ブースティングの結果と同じになっている。
|
1 2 3 4 5 6 7 |
svc = SVC(C=1000, gamma='auto').fit(X_train_scaled, y_train) print("Training score:{:.3f}".format(svc.score(X_train_scaled, y_train))) print("Test score :{:.3f}".format(svc.score(X_test_scaled, y_test))) # Training score:0.988 # Test score :0.972 |
さらにいくつかのCとgammaで試してみると、特にスコアがいいのは以下のケースだった。なおgamma=1, 10の場合、C=100, 1000, 10000に対して訓練スコアが1.000、テストスコアが0.95程度で全て過学習となった。
| C | gamma | 訓練スコア | テストスコア |
| 1000 | auto | 0.988 | 0.972 |
| 1000 | 0.01 | 0.986 | 0.979 |
| 100 | 0.1 | 0.986 | 0.972 |