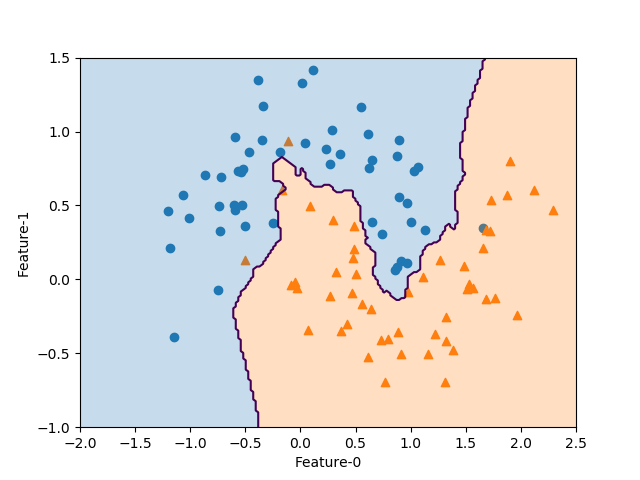
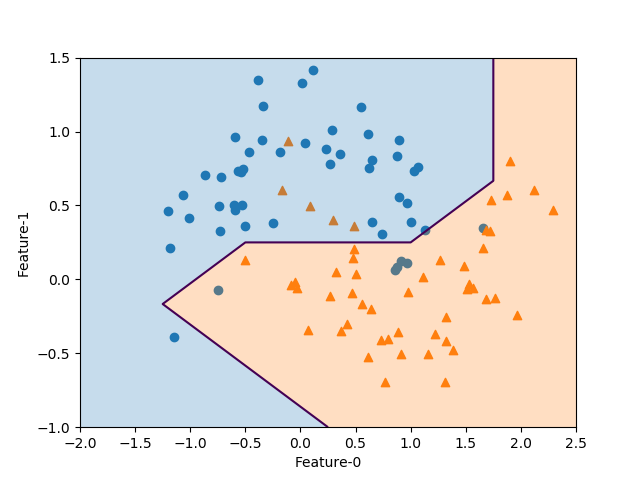
決定境界の描き方として以前ループを使った泥臭い方法を考えたが、meshgridを使って数行で書けることを知ったのでまとめ。
結論としては以下の19~25行目の8行で、以下の手順で決定境界を書いている。
- 2つの特徴量の全領域をカバーする値を
numpy.linspace()で生成 numpy.meshgrid()で2次元のグリッドに変換- 各特徴量のメッシュグリッドを1次元に変形し、縦2列の配列化
prediction()メソッドでその配列の各座標に対応する予測値を計算(結果は1次元配列)- 結果の配列をmeshgridと同じ形状の2次元配列に変形
contour/contourf()で決定境界を描画
|
1 2 3 4 5 6 7 8 9 10 11 12 13 14 15 16 17 18 19 20 21 22 23 24 25 26 27 28 29 30 31 32 |
import numpy as np import matplotlib.pyplot as plt from sklearn.datasets import make_moons from sklearn.neighbors import KNeighborsClassifier X, y = make_moons(n_samples=100, noise=0.25, random_state=3) x0_min, x0_max = -2.0, 2.5 x1_min, x1_max = -1.0, 1.5 knn = KNeighborsClassifier(n_neighbors=3).fit(X, y) fig, ax = plt.subplots() color0, color1 = 'tab:blue', 'tab:orange' ax.scatter(X[y==0][:, 0], X[y==0][:, 1], marker='o') ax.scatter(X[y==1][:, 0], X[y==1][:, 1], marker='^') f0 = np.linspace(x0_min, x0_max, 200) f1 = np.linspace(x1_min, x1_max, 200) f0, f1 = np.meshgrid(f0, f1) pred = knn.predict(np.hstack([f0.reshape(-1, 1), f1.reshape(-1, 1)])) \ .reshape(f0.shape) ax.contour(f0, f1, pred, levels=[0.5]) ax.contourf(f0, f1, pred, levels=1, colors=[color0, color1], alpha=0.25) ax.set_xlim(x0_min, x0_max) ax.set_ylim(x1_min, x1_max) ax.set_xlabel("Feature-0") ax.set_ylabel("Feature-1") plt.show() |

具体的な変数の変形状況を要素数4の少ない例で示すと以下の通り。
まず、2つの特徴量の範囲の数列を生成する。
|
1 2 3 4 5 6 7 |
f0 = np.linspace(x0_min, x0_max, 4) f1 = np.linspace(x1_min, x1_max, 4) print(f0) print(f1) # [-2. -0.5 1. 2.5] # [-1. -0.16666667 0.66666667 1.5 ] |
それらの数列を、meshgridで2次元配列に変形する。
|
1 2 3 4 5 6 7 8 9 10 11 12 |
f0, f1 = np.meshgrid(f0, f1) print(f0) print(f1) # [[-2. -0.5 1. 2.5] # [-2. -0.5 1. 2.5] # [-2. -0.5 1. 2.5] # [-2. -0.5 1. 2.5]] # [[-1. -1. -1. -1. ] # [-0.16666667 -0.16666667 -0.16666667 -0.16666667] # [ 0.66666667 0.66666667 0.66666667 0.66666667] # [ 1.5 1.5 1.5 1.5 ]] |
予測モデルに与える変数は各特徴量を列とする2次元配列とする必要があるので、まず上の2次元配列をそれぞれ1次元に変形。この変形では、2次元配列の各行を連ねていった1行の配列を列ベクトルにした形になる。
|
1 2 3 4 5 6 7 8 9 10 11 12 13 14 15 16 17 18 19 20 21 22 23 24 25 26 27 28 29 30 31 32 33 34 35 |
print(f0.reshape(-1, 1)) print(f1.reshape(-1, 1)) # [[-2. ] # [-0.5] # [ 1. ] # [ 2.5] # [-2. ] # [-0.5] # [ 1. ] # [ 2.5] # [-2. ] # [-0.5] # [ 1. ] # [ 2.5] # [-2. ] # [-0.5] # [ 1. ] # [ 2.5]] # [[-1. ] # [-1. ] # [-1. ] # [-1. ] # [-0.16666667] # [-0.16666667] # [-0.16666667] # [-0.16666667] # [ 0.66666667] # [ 0.66666667] # [ 0.66666667] # [ 0.66666667] # [ 1.5 ] # [ 1.5 ] # [ 1.5 ] # [ 1.5 ]] |
次に2つの列ベクトルを横方向に並べて、総計算データ数×特徴量数(2)の2次元配列とする。
|
1 2 3 4 5 6 7 8 9 10 11 12 13 14 15 16 17 18 |
print(np.hstack([f0.reshape(-1, 1), f1.reshape(-1, 1)])) # [[-2. -1. ] # [-0.5 -1. ] # [ 1. -1. ] # [ 2.5 -1. ] # [-2. -0.16666667] # [-0.5 -0.16666667] # [ 1. -0.16666667] # [ 2.5 -0.16666667] # [-2. 0.66666667] # [-0.5 0.66666667] # [ 1. 0.66666667] # [ 2.5 0.66666667] # [-2. 1.5 ] # [-0.5 1.5 ] # [ 1. 1.5 ] # [ 2.5 1.5 ]] |
この配列の各座標に対する予測値を、predict()メソッドで予測。この結果は、1次元化されたf0やf1と同じく、2次元のmeshgridの各行を横に連ねたものになっている。
|
1 2 3 |
print(knn.predict(np.hstack([f0.reshape(-1, 1), f1.reshape(-1, 1)]))) # [0 0 1 1 0 1 1 1 0 0 0 1 0 0 0 1] |
この結果を、meshgrid化されたf0(またはf1)と同じ形に変形。これで予測結果がf0×f1平面の各座標に対応した予測値の2次元配列となっている。
|
1 2 3 4 5 6 |
print(knn.predict(np.hstack([f0.reshape(-1, 1), f1.reshape(-1, 1)])).reshape(f0.shape)) # [[0 0 1 1] # [0 1 1 1] # [0 0 0 1] # [0 0 0 1]] |
この結果を使い、contour()/contourf()で決定境界あるいは決定領域を描画。
|
1 2 3 4 |
pred = knn.predict(np.hstack([f0.reshape(-1, 1), f1.reshape(-1, 1)])) \ .reshape(f0.shape) ax.contour(f0, f1, pred, levels=[0.5]) ax.contourf(f0, f1, pred, levels=1, colors=[color0, color1], alpha=0.25) |

ここでlevelsの指定は以下のようにしている。
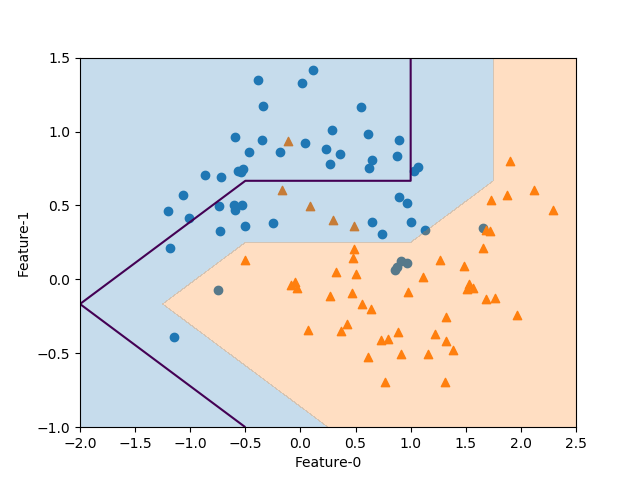
まずcontour()の場合、ドキュメンテーションには“If an int n, use n data intervals; i.e. draw n+1 contour lines. The level heights are automatically chosen.”と書かれているので、levels=0と指定すると0+1本の線が描かれると考えたが以下のような警告が出て線の位置がずれた。
|
1 2 |
serWarning: No contour levels were found within the data range. ax.contour(f0, f1, pred, levels=0) |

そこでlevels=[0.5]と2つのクラス値0と1の間をとると適切に表示される。
なおcontourf()のときは、levels=1として2つの領域が描かれる。