概要
sklearn.preprocessingモジュールのMinMaxScalerは、各特徴量が0~1の範囲に納まるように変換する。具体的には、特徴量Fiの最小値(mini)と最大値(maxi)から以下の式により各特徴量FiをFi*に変換する。
(1) ![]()
挙動
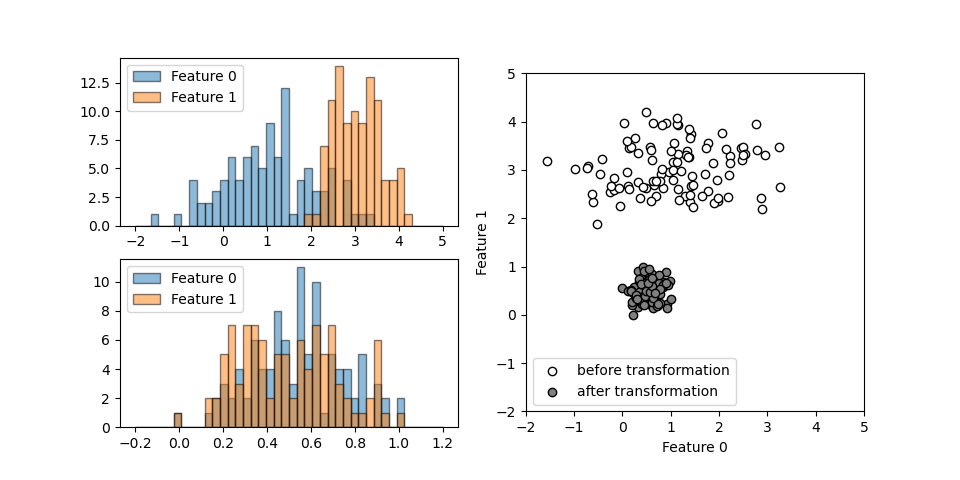
それぞれ異なる正規分布に従う2つの特徴量について、MinMaxScalerを適用したときの挙動を以下に示す。異なる大きさとレンジの特徴量が、変換後にはいずれも0~1の間に納まっているのが確認できる。

コードは以下の通りで、データに対してfit()メソッドでスケールパラメーターを決定し、transform()メソッドで変換を行うところを、これらを連続して実行するfit_transform()メソッドを使っている。
|
1 2 3 4 5 6 7 8 9 10 11 12 13 14 15 16 17 18 19 20 21 22 23 24 25 26 27 28 29 30 31 32 33 34 35 36 37 38 39 40 |
import numpy as np import numpy.random as rnd import matplotlib.pyplot as plt from sklearn.preprocessing import MinMaxScaler rnd.seed(0) x1 = rnd.normal(loc=1, scale=1, size=100) x2 = rnd.normal(loc=3, scale=0.5, size=100) X = np.hstack((x1.reshape(-1, 1), x2.reshape(-1, 1))) scaler = MinMaxScaler() X_transformed = scaler.fit_transform(X) fig = plt.figure(figsize=(9.6, 4.8)) ax1 = fig.add_subplot(2, 2, 1) ax2 = fig.add_subplot(2, 2, 3) ax3 = fig.add_subplot(1, 2, 2) ax1.hist(X[:, 0], ec='k', range=(-2, 5), bins=40, alpha=0.5, label="Feature 0") ax1.hist(X[:, 1], ec='k', range=(-2, 5), bins=40, alpha=0.5, label="Feature 1") ax1.legend(loc='upper left') ax2.hist(X_transformed[:, 0], range=(-0.2, 1.2), bins=40, ec='k', alpha=0.5, label="Feature 0") ax2.hist(X_transformed[:, 1], range=(-0.2, 1.2), bins=40, ec='k', alpha=0.5, label="Feature 1") ax2.legend(loc='upper left') ax3.scatter(X[:, 0], X[:, 1], ec='k', fc='w', label="before transformation") ax3.scatter(X_transformed[:, 0], X_transformed[:, 1], ec='k', fc='gray', label="after transformation") ax3.set_aspect('equal') ax3.set_xlim(-2, 5) ax3.set_ylim(-2, 5) ax3.set_xlabel("Feature 0") ax3.set_ylabel("Feature 1") ax3.legend() plt.show() |
特徴
MinMaxScalerは簡明な方法だが、極端に値が離れた異常値が発生すると本来のデータがその影響を受ける場合がある。