機械学習モデルにデータを適用するための前処理としていくつかのアルゴリズムによっては、異常値の影響を受けやすいことがある。
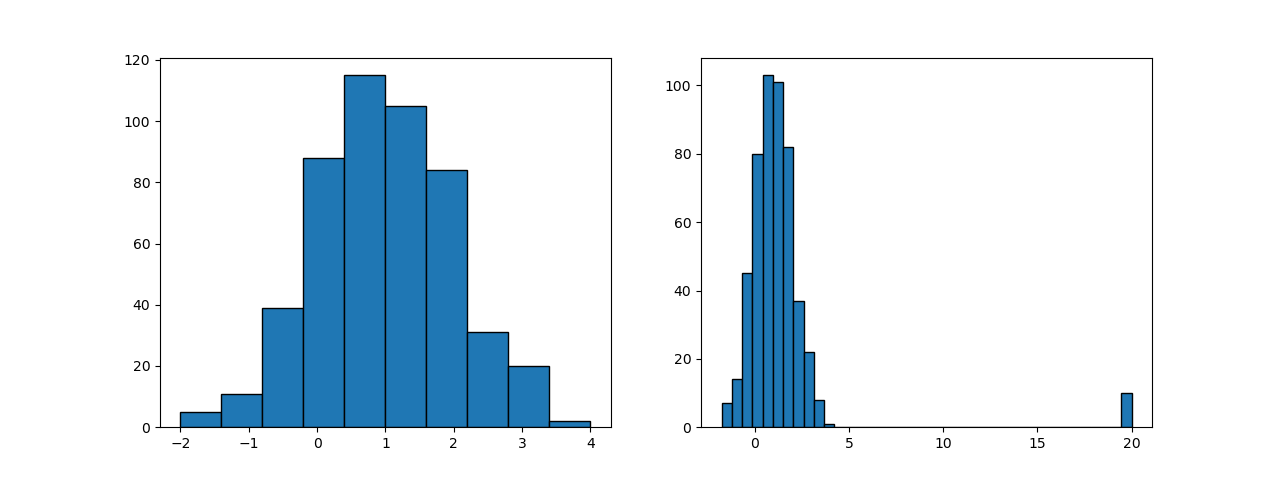
たとえば下図の左のような分布のデータがあるとする(平均が1、分散が1の正規分布に従う500個のランダムデータ)。そしてこのデータに値20の異常値が10個発生したとすると、全体の分布は右のようになる。

このデータに対して、MinMaxScaler、StandardScaler、RobustScalerで変換した結果を以下に示す。ただしStandardScalerとRobustScalerについては、異常値は表示させず元の正規分布に係る範囲のみを表示している。

まず左側のMinMaxScalerについては、異常値を含めてレンジが0~1となるので、本体の正規分布のデータが0付近の小さな値に集中する。このため、本来学習の精度に効いてくるべき本体部分のデータの分離が十分でない可能性が出てくる。
真ん中のStandardScalerと右側のRobustScalerについては、本体部分の形は元の正規分布の形と大きく変わらず、頑健であることがわかる。
ここで異常値の個数を10個から20個に増やして、同じく3種類の変換を施してみる。

左側のMinMaxScalerについては、異常値の個数とは関係なくその値のみでレンジが決まり、元の分布が0付近に押し込められている状況は同じ。
真ん中のStandardScalerについては、10個の時に比べて少し分布の形が変わっていて、レンジが狭くなっている。
右側のRobustScalerについては、元の分布の形は大きくは変わっていない。
以上のことから、少なくとも3つの変換器について以下のような特徴があることがわかる。
- MinMaxScalerは異常値によって本来分析したいデータのレンジが狭くなる可能性がある
- StandardScalerは異常値の影響を受けにくいが、その大きさや頻度によって若干本体部分の分布が影響を受ける
- RobustScalerは異常値の個数が極端に多くなければ、本来のデータの特性を頑健に保持する
なお、上記の作図のコードは以下の通り。
|
1 2 3 4 5 6 7 8 9 10 11 12 13 14 15 16 17 18 19 20 21 22 23 24 25 26 27 28 29 30 31 32 33 34 35 36 37 38 39 40 41 42 43 44 45 46 47 48 49 50 51 52 53 54 55 56 57 |
import numpy as np import numpy.random as rnd import matplotlib.pyplot as plt from sklearn.preprocessing import MinMaxScaler from sklearn.preprocessing import StandardScaler from sklearn.preprocessing import RobustScaler rnd.seed(0) x = rnd.normal(loc=1, scale=1, size=500) x1 = np.append(x, [20] * 10) x2 = np.append(x, [20] * 20) scaler = MinMaxScaler() x1_scaled_by_minmax = scaler.fit_transform(x1.reshape(-1, 1)) x2_scaled_by_minmax = scaler.fit_transform(x2.reshape(-1, 1)) scaler = StandardScaler() x1_scaled_by_standard = scaler.fit_transform(x1.reshape(-1, 1)) x2_scaled_by_standard = scaler.fit_transform(x2.reshape(-1, 1)) scaler = RobustScaler() x1_scaled_by_robust = scaler.fit_transform(x1.reshape(-1, 1)) x2_scaled_by_robust = scaler.fit_transform(x2.reshape(-1, 1)) fig0, axes = plt.subplots(1, 2, figsize=(12.8, 4.8)) axes[0].hist(x1, ec='k', bins=10, range=(-2, 4)) axes[1].hist(x1, ec='k', bins=40) fig1, axes = plt.subplots(1, 3, figsize=(18.6, 4.8)) ax = axes[0] ax.hist(x1_scaled_by_minmax, ec='k', bins=40) ax.set_title("MinMaxScaler") ax = axes[1] ax.hist(x1_scaled_by_standard, ec='k', bins=10, range=(-1.5, 1)) ax.set_title("StandardScaler") ax = axes[2] ax.hist(x1_scaled_by_robust, ec='k', bins=10, range=(-2.5, 2.5)) ax.set_title("RobustScaler") fig2, axes = plt.subplots(1, 3, figsize=(18.6, 4.8)) ax = axes[0] ax.hist(x2_scaled_by_minmax, ec='k', bins=40) ax.set_title("MinMaxScaler") ax = axes[1] ax.hist(x2_scaled_by_standard, ec='k', bins=10, range=(-1.5, 1)) ax.set_title("StandardScaler") ax = axes[2] ax.hist(x2_scaled_by_robust, ec='k', bins=10, range=(-2.5, 2.5)) ax.set_title("RobustScaler") plt.show() |