概要
Scikit-learnで提供されているLFW peopleデータセットを、主成分分析を使って分析する。
データの読み込みと確認
LFWデータセットは世界の著名人の顔画像を、その名前とそれに対応するクラスデータとともに格納したものである。
書籍”Pythonではじめる機械学習”に沿って、画像サイズを0.7にし、20枚以上の画像がある人物を抽出する。
|
1 2 3 4 5 6 7 8 9 10 11 12 13 14 15 |
import matplotlib.pyplot as plt from sklearn.datasets import fetch_lfw_people ds = fetch_lfw_people(min_faces_per_person=20, resize=0.7) fig, axes = plt.subplots(2, 5, figsize=(6.4, 2.4), subplot_kw={'xticks':(), 'yticks':()}) fig.subplots_adjust(hspace=0.4) for target, image, axis in zip(ds.target, ds.images, axes.ravel()): axis.imshow(image, cmap='gray') axis.set_title(ds.target_names[target], fontsize=8) plt.show() |
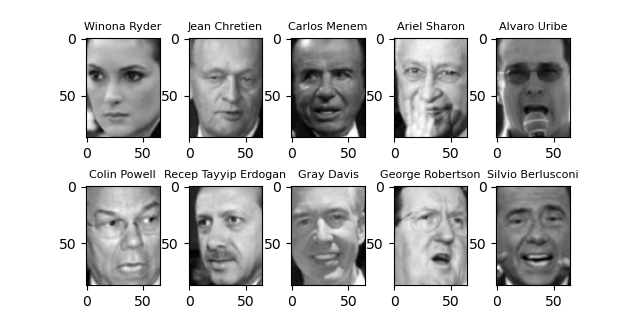
画像の人物は書籍と同じだが顔画像は異なっている。書籍執筆後画像データが追加/変更されたものと思われる。
画像の枚数の絞り込み
元のコード
LFW peopleの画像データは、人物によって枚数にばらつきがある(特にGeorge Bushだけ500枚を超えている)。画像データの多寡によるばらつきを抑えるため、書籍では画像の数を50枚までとし、それ以上の画像は切り落としている。
このコードがちょっとわかり難かったので、別にこちらで整理している。
|
1 2 3 4 5 6 7 8 9 10 11 12 13 14 15 16 17 18 19 20 21 22 23 24 25 26 27 28 29 30 31 |
import numpy as np from sklearn.datasets import fetch_lfw_people ds = fetch_lfw_people(min_faces_per_person=20, resize=0.7) mask = np.zeros(ds.target.shape, dtype=np.bool) for target in np.unique(ds.target): mask[np.where(ds.target == target)[0][:50]] = 1 X_people = ds.data[mask] y_people = ds.target[mask] X_people /= 255 print(X_people.shape) # (2063, 5655) print(y_people.shape) # (2063,) print(X_people) # [[0.22091503 0.23660131 0.30457515 ... 0.06928104 0.06666667 0.08888888] # [0.2627451 0.31764707 0.3477124 ... 0.03398693 0.03267974 0.03660131] # [0.07450981 0.05882353 0.05882353 ... 0.08888888 0.08888888 0.10065359] # ... # [0.13986929 0.0875817 0.10849673 ... 0.05751634 0.02614379 0.02091503] # [0.2130719 0.25882354 0.22091503 ... 0.82222223 0.82483655 0.8326797 ] # [0.43529412 0.50326794 0.57124186 ... 0.05359477 0.05359477 0.05490196]] print(y_people) # [61 25 9 ... 9 37 22] |
k-近傍法との組み合わせによる精度の確認
書籍では、画像を50枚以下に制限したデータについて、k-近傍法(knn)を適用したときのスコア、元データを主成分分析によって変換した場合のknnのスコアを確認している。
- 画像データを最近傍データ1つで判定する1-nnの実行結果は、スコアは0.23と低い
- 元の画像データを100個の主成分で変換したデータに対しては、1-nnのスコアは0.31と若干向上
- PCAインスタンス生成時にwhiten=Trueを指定しない場合、PCA変換後もスコアは向上しなかった
主成分の可視化
PCA.fit()を実行すると、PCA.components_に主成分が格納される。components_は2次元配列で、[主成分の数, 元の特徴量数]という形になっている。たとえば今回のデータの場合、主成分の数はn_componentsで指定した100、特徴量の数は画像のピクセル数87×65=5655となり、components_は100×5655の2次元配列になっている。
(1) ![Rendered by QuickLaTeX.com \begin{equation*} \tt{components_} = \left[ \begin{array}{ccc} (p_{0, 0} & \cdots & p_{0, 5654} ) \\ & \vdots &\\ (p_{99, 0} & \cdots & p_{99, 5654}) \end{array} \right] = \left[ \begin{array}{c} \boldsymbol{p}_0 \\ \vdots \\ \boldsymbol{p}_{99} \end{array} \right] \end{equation*}](http://taustation.com/wp1/wp-content/ql-cache/quicklatex.com-b4d7134f6fddda45ca58b0314e5a6960_l3.png)
components_に収められた主成分はそれぞれが画像データと同じサイズの配列なので、これらを画像として表示させてみる。
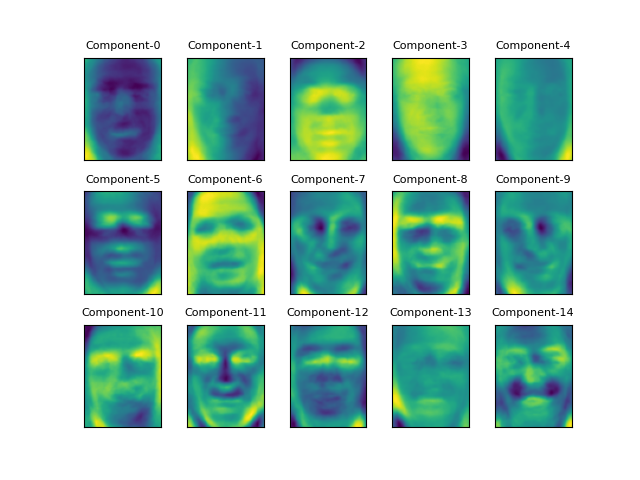
たとえばComponent-0は顔と背景のコントラスト、Component-2は顔の左右の明るさの差をコーディングしているように見える、と書籍では解説している。その他にも、Component-5は目の下の出っ張った部分、Component-11は鼻筋のあたりを表現しているかもしれないといった想像はできる。
上の画像は以下のコードで表示させたが、要点は以下の通り。
- 最低20枚の画像を持つ人物のみ読み込んでいる
- 画像の最大数を50枚以下に制限している
- 訓練データとテストデータに分割し、訓練データを主成分分析にかけている
components_プロパティーの主成分配列のうち、15行分を取り出して表示させている- 表示にあたって、リニアな5655の要素を画像の形(87, 65)に変形している
- components_の形状が、100行×5655の2次元配列であることを確認
|
1 2 3 4 5 6 7 8 9 10 11 12 13 14 15 16 17 18 19 20 21 22 23 24 25 26 27 28 29 30 31 32 33 34 35 36 37 38 39 40 41 |
import numpy as np import matplotlib.pyplot as plt from sklearn.datasets import fetch_lfw_people from sklearn.model_selection import train_test_split from sklearn.decomposition import PCA from sklearn.neighbors import KNeighborsClassifier ds = fetch_lfw_people(min_faces_per_person=20, resize=0.7) image_shape = ds.images[0].shape mask = np.zeros(ds.target.shape, dtype=np.bool) for target in np.unique(ds.target): mask[np.where(ds.target == target)[0][:50]] = 1 X_people = ds.data[mask] y_people = ds.target[mask] X_people /= 255 X_train, X_test, y_train, y_test = train_test_split( X_people, y_people, stratify=y_people, random_state=0) pca = PCA(n_components=100, whiten=True, random_state=0).fit(X_train) fig, axes = plt.subplots(3, 5, subplot_kw={'xticks':(), 'yticks':()}) fig.subplots_adjust(hspace=0.3) for i, (component, axis) in enumerate(zip(pca.components_, axes.ravel())): axis.imshow(component.reshape(image_shape)) axis.set_title("Component-{}".format(i), fontsize=8) plt.show() print("image shape: {}".format(image_shape)) print("image size : {}".format(image_shape[0] * image_shape[1])) print("components shape : {}".format(pca.components_.shape)) # image shape: (87, 65) # image size : 5655 # components shape : (100, 5655) |
次元圧縮された主成分からの復元
概要
主成分の意味の一つとして、元のデータは主成分の線形和で表せるという解釈がある。
(2) ![]()
LFWの顔画像データで考えると、components_に収められた主成分の重みによって、元のそれぞれの人物の画像を再現しようとすることになる。
そこで、限られた主成分だけを用いて元の顔画像を再現してみる。
顔画像の選定
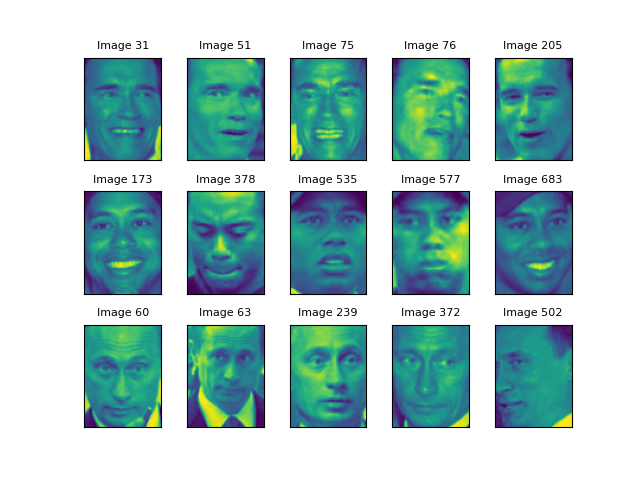
まず、特に有名な人物の顔画像をいくつか表示させてみた。選んだ人物は、Arnold Schwarzenegger, Tiger Woods, Vladimir Putinの3人。
|
1 2 3 4 5 6 7 8 9 10 11 12 13 14 15 16 17 18 19 20 21 22 23 24 25 26 27 28 29 30 |
import numpy as np import matplotlib.pyplot as plt from sklearn.datasets import fetch_lfw_people from sklearn.model_selection import train_test_split from sklearn.decomposition import PCA ds = fetch_lfw_people(min_faces_per_person=20, resize=0.7) image_shape = ds.images[0].shape names = ['Arnold Schwarzenegger', 'Tiger Woods', 'Vladimir Putin'] mask = np.zeros(ds.target.shape, dtype=np.bool) for target in np.unique(ds.target): mask[np.where(ds.target == target)[0][:50]] = 1 X_people = ds.data[mask] y_people = ds.target[mask] X_people /= 255 fig, axes = plt.subplots(3, 5, subplot_kw={'xticks':(), 'yticks':()}) fig.subplots_adjust(hspace=0.3) for name, axes_row in zip(names, axes): id = np.where(ds.target_names == name)[0][0] for image_num, axis in zip(np.where(ds.target == id)[0][:5], axes_row): axis.imshow(ds.images[image_num]) axis.set_title("Image {}".format(image_num), fontsize=8) plt.show() |
これらの画像から、一旦次元削減して復元する画像を選ぶ。Shwalzzeneggerは正面少し左向きの31番、Tiger Woodsは少し右側から撮った歯を出している683番、Putinは左を向いた顔をほぼ正面から撮った372番を選んだ。
次元削減後の逆変換
そして次元数を変化させながらPCAモデルに全データを学習させ、それらのモデルで3枚の画像を変形し、逆変換する。
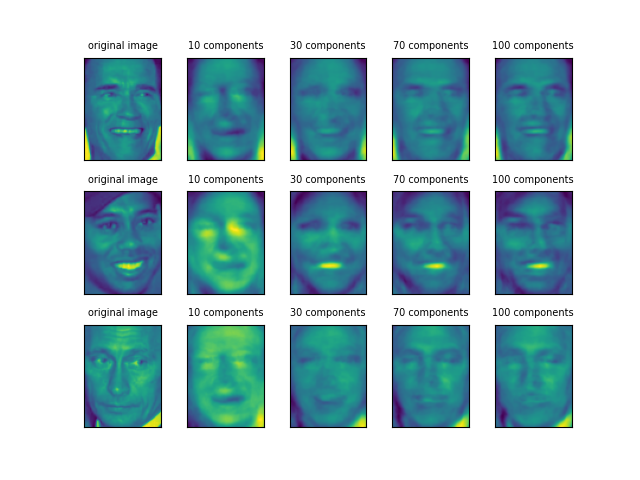
10個の主成分では、3人とも似たような顔になっているが、30個になると顔の方向や葉を出しているかどうかといった特徴が表れ始めている。
70個から100個にかけて、ShwaltzeneggerとWoodsはかなり元の顔に近いが、Putinはあまり判然としない。前者2人が「濃い」顔立ちなのに比べると、Putinの顔立ちは平板だということだろうか。
この画像は、以下の手順で作成した。
- 20枚以上の画像を持つ人物を選び、画像の枚数を50枚以下に制限
- 3人の顔画像について、次元数を10、30、70、100と変化させて以下を実行
- 設定された次元数で全データを学習
- 学習済みモデルで各顔画像を変換(ここで次元が削減される)
- 設定された次元数で元の顔画像に逆変換
|
1 2 3 4 5 6 7 8 9 10 11 12 13 14 15 16 17 18 19 20 21 22 23 24 25 26 27 28 29 30 31 32 33 34 35 36 37 |
import numpy as np import matplotlib.pyplot as plt from sklearn.datasets import fetch_lfw_people from sklearn.model_selection import train_test_split from sklearn.decomposition import PCA ds = fetch_lfw_people(min_faces_per_person=20, resize=0.7) image_shape = ds.images[0].shape mask = np.zeros(ds.target.shape, dtype=np.bool) for target in np.unique(ds.target): mask[np.where(ds.target == target)[0][:50]] = 1 X_people = ds.data[mask] y_people = ds.target[mask] X_people /= 255 images = [31, 683, 372] n_component_list = [10, 30, 70, 100] fig, axes = plt.subplots(3, 5, subplot_kw={'xticks':(), 'yticks':()}) fig.subplots_adjust(hspace=0.3) for r, image_id in enumerate(images): axes[r, 0].imshow(ds.images[image_id]) axes[r, 0].set_title("original image", fontsize=7) for c, n_components in enumerate(n_component_list): pca = PCA(n_components=n_components, whiten=True, random_state=0).fit(X_people) for r, image_id in enumerate(images): image_trans = pca.transform(ds.data[image_id].reshape(1, -1)) image_inv = pca.inverse_transform(image_trans) axes[r, c + 1].imshow(image_inv.reshape(image_shape)) axes[r, c + 1].set_title("{} components".format(n_components), fontsize=7) plt.show() |
同一人物の画像
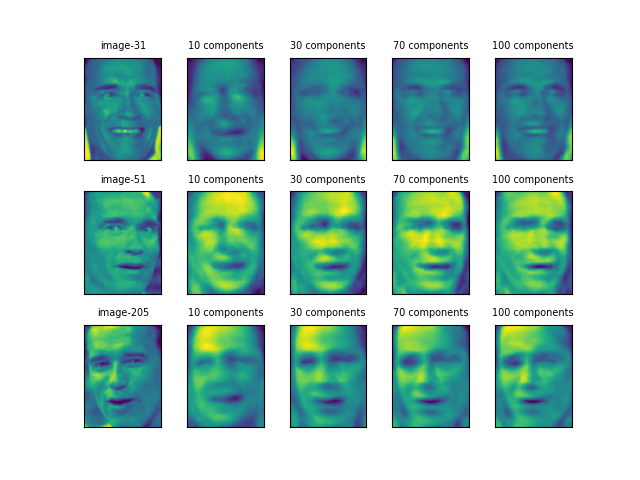
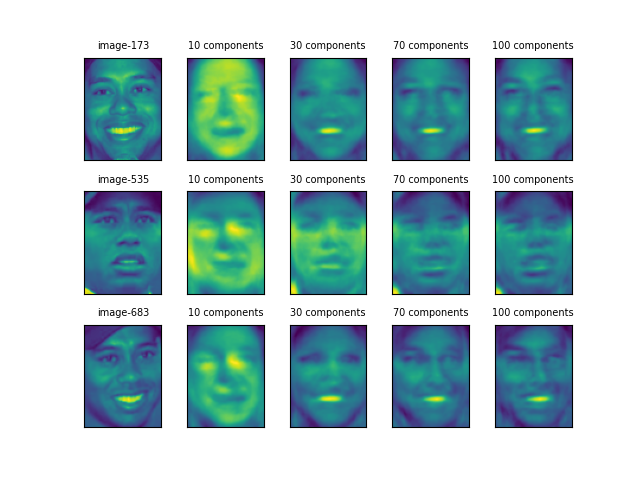
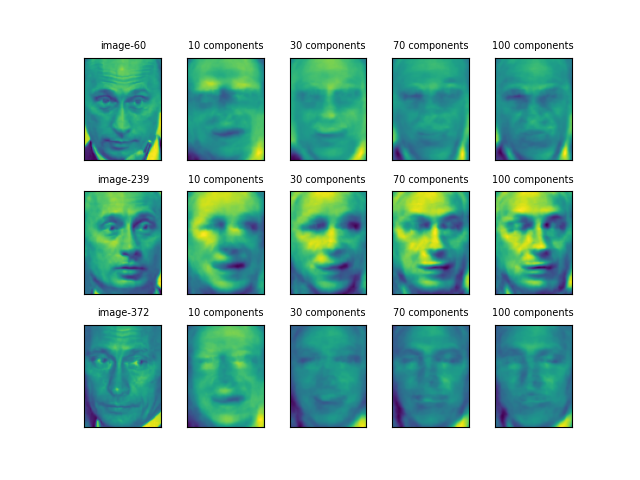
さらに、3人について1人ずつ、3枚の顔画像について同様のことを行った結果が以下の通り。
Shwalzeneggerの後半2枚は向きが逆だが口元などがよく似ていて、目元と口元の特徴が強調されている。1枚目の画像はこの2枚と特徴が違うが、主成分30個あたりではよく似た感じともいえる。
Tiger Woodsも、主成分30個のところで173と683の画像が似ている。だが、535については一貫して他の2つと異なっているように見える。個人の特徴よりも顔の表情に大きく引きずられているようだ。
Putinは60と372の画像が割に似ているが、239の画像はかなり異なり、コントラストが強調されているようだ。60や372では、そもそも顔画像が平板なせいなのか、主成分を増やしても明確な画像が得られていない(他の人物との区別も難しいのではないだろうか)。
第2主成分までによるクラスの分布
第1主成分と第2主成分だけを使って、各クラスの分布をみてみる。62人の人物の各画像データが1つの点に対応している。2つの主成分だけでは人物が明確なクラスターとしては認識し難い(というよりもクラスが多すぎて識別も難しい)。
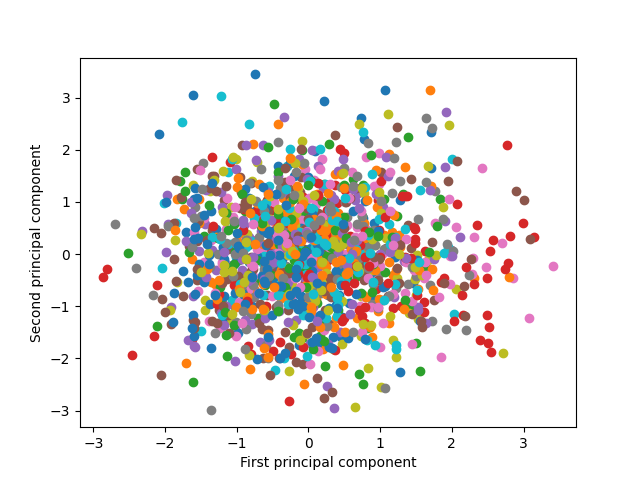
試しに表示するクラスを5つに限定してみる。やはり2つの主成分では明確なクラスターは確認できない。先ほどの変換・逆変換の結果でも、主成分10個でも個々の顔の識別は困難だったので、2つの主成分では難しいのは自明だが。
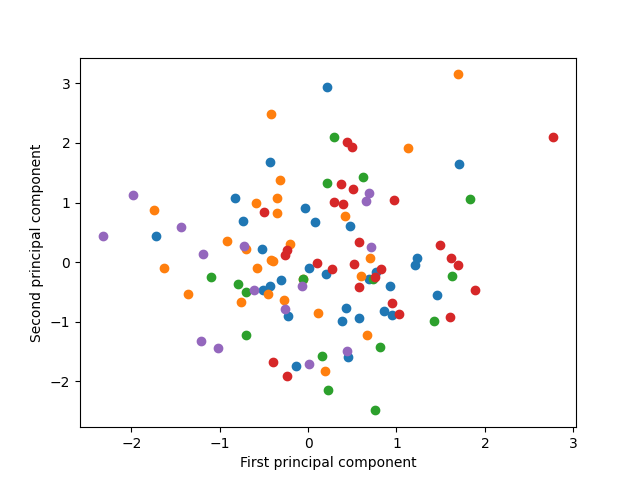
以上の可視化のコードは以下の通り。
|
1 2 3 4 5 6 7 8 9 10 11 12 13 14 15 16 17 18 19 20 21 22 23 24 25 26 27 28 29 30 31 32 33 34 35 36 37 38 39 40 41 42 43 44 |
import numpy as np import matplotlib.pyplot as plt from sklearn.datasets import fetch_lfw_people from sklearn.model_selection import train_test_split from sklearn.decomposition import PCA ds = fetch_lfw_people(min_faces_per_person=20, resize=0.7) mask = np.zeros(ds.target.shape, dtype=np.bool) for target in np.unique(ds.target): mask[np.where(ds.target == target)[0][:50]] = 1 X_people = ds.data[mask] y_people = ds.target[mask] X_people /= 255 X_train, X_test, y_train, y_test = train_test_split( X_people, y_people, stratify=y_people, random_state=0) pca = PCA(n_components=3, whiten=True, random_state=0).fit(X_train) X_trans = pca.transform(X_train) target_classes = np.unique(y_train) fig, axis = plt.subplots() for target_class in target_classes[:5]: mask = np.zeros(y_train.shape, dtype=np.bool) mask[np.where(y_train == target_class)] = 1 axis.scatter(X_trans[mask, 0], X_trans[mask, 1]) axis.set_xlabel("First principal component") axis.set_ylabel("Second principal component") plt.show() print("components_.shape : {}".format(pca.components_.shape)) print("X_train -> X_trans: {} -> {}".format(X_train.shape, X_trans.shape)) print("y_train.shape : {}".format(y_train.shape)) # components_.shape : (3, 5655) # X_train -> X_trans: (1547, 5655) -> (1547, 3) # y_train.shape : (1547,) |