概要
breast-cancerデータセットにscikit-learnのLogisticRegressionクラスでLogistic回帰を適用した結果。
手法全般の適用の流れはLogistic回帰~cancer~Pythonではじめる機械学習よりを参照。
ここではハイパーパラメーターを変化させたときの学習率の違いをみている。
学習率曲線
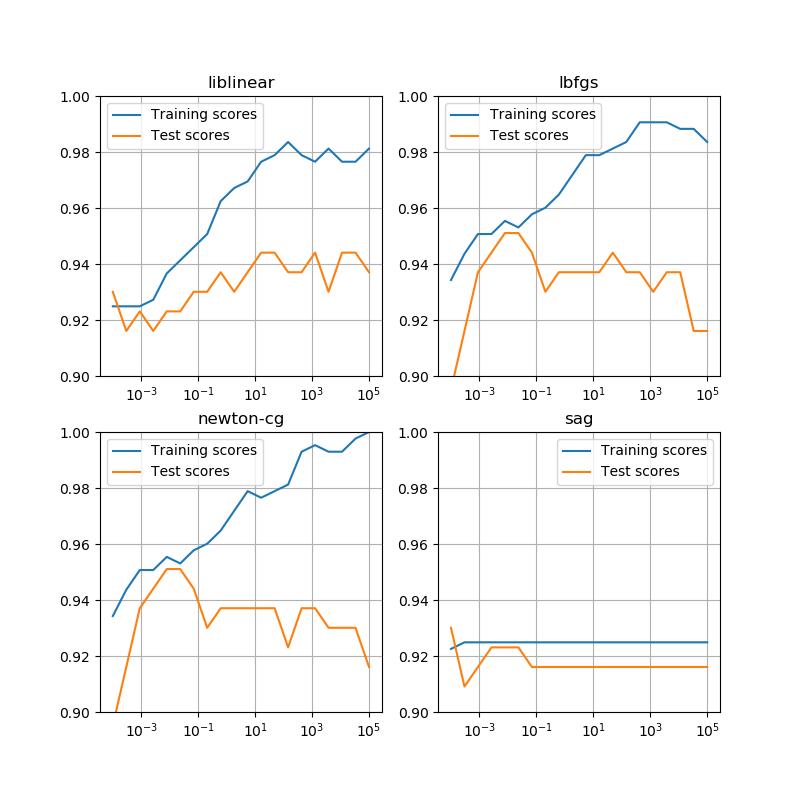
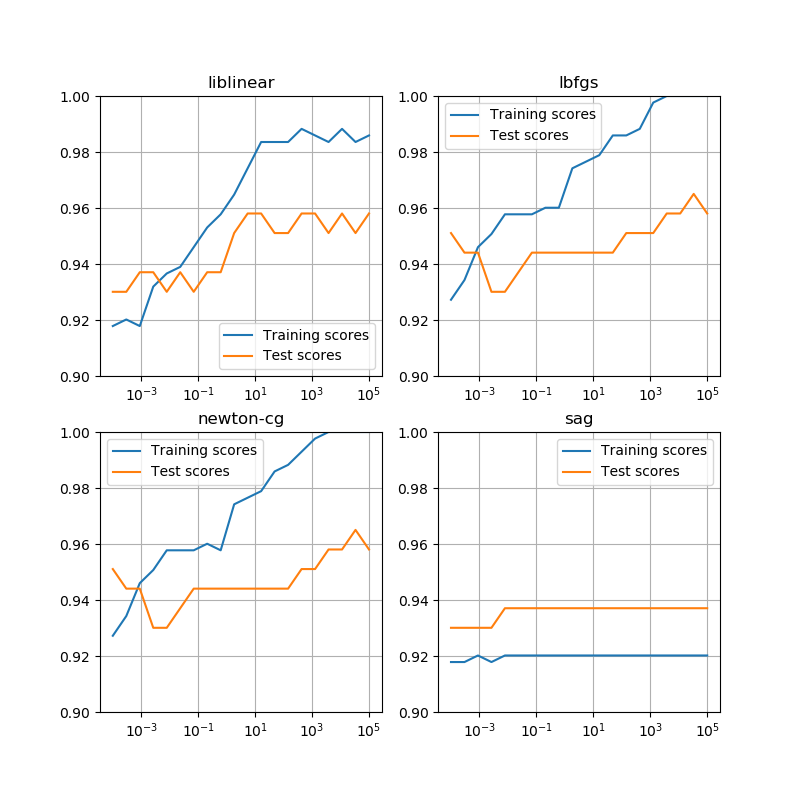
scikit-learnのLogisticRegressionクラスで、正則化のパラメーターを変化させたときの学習率曲線。同クラスにはsolver引数で収束計算のいくつかの手法が選択できるが、収束手法の違いによって意外に学習率曲線に違いが出た。またtrain_test_split()のrandom_stateを変えても違いがある。569のデータセットで訓練データとテストデータを分けてもいるが、その程度では結構ばらつきが出るということかもしれない。
まず、random_state=0とした場合の、4つの収束手法における学習率曲線を示す。L-BFGSは準ニュートン法の1つらしいので、Newton-CGと同じ傾向であるのは頷ける。SAG(Stochastic Average Gradient)はまた違った計算方法のようで、他の手法と随分挙動が異なる。収束回数はmax_iter=10000で設定していて、これくらいでも計算回数オーバーの警告がいくつか出る。回数をこれより2オーダー多くしても、状況はあまり変わらない。

random_state=11としてみると、liblinearでは大きく違わないが、他の3つの手法では傾向が違っていて、特にsagを用いた場合は訓練データの学習率の方がテストデータの学習率よりも低くなっている。

|
1 2 3 4 5 6 7 8 9 10 11 12 13 14 15 16 17 18 19 20 21 22 23 24 25 26 27 28 29 30 31 32 33 34 35 36 37 38 39 40 41 42 |
import numpy as np import pandas as pd import matplotlib.pyplot as plt from sklearn.model_selection import train_test_split from sklearn.linear_model import LogisticRegression from sklearn.datasets import load_breast_cancer ds = load_breast_cancer() df = pd.DataFrame(ds.data, columns=ds.feature_names) X_train, X_test, y_train, y_test = \ train_test_split(df, ds.target, stratify=ds.target, random_state=0) C_sup = np.linspace(5, -4, 20) C_val = 10**C_sup solvers = ['liblinear', 'lbfgs', 'newton-cg', 'sag'] fig, axs = plt.subplots(2, 2, figsize=(8, 8)) axs_1d = axs.reshape(-1) for ax, solver in zip(axs_1d, solvers): train_scores = np.empty(0) test_scores = np.empty(0) for C in C_val: logreg = LogisticRegression(C=C, solver=solver, max_iter=10000) logreg.fit(X_train, y_train) train_scores = np.append(train_scores, logreg.score(X_train, y_train)) test_scores = np.append(test_scores, logreg.score(X_test, y_test)) ax.plot(C_val, train_scores, label="Training scores") ax.plot(C_val, test_scores, label="Test scores") ax.set_xscale('log') ax.set_ylim(0.9, 1) ax.grid(True) ax.legend() ax.set_title(solver) plt.show() |