概要
breast_cancerデータは、複数の乳癌患者に関する細胞診の結果と診断結果に関するデータセットで、569人について腫瘤の細胞診に関する30の特徴量と診断結果(悪性/良性)が格納されている。このデータセットについて、irisデータセットと同じ流れで、一般的なグラフによる可視化によって俯瞰してみる。
各特徴量と診断結果
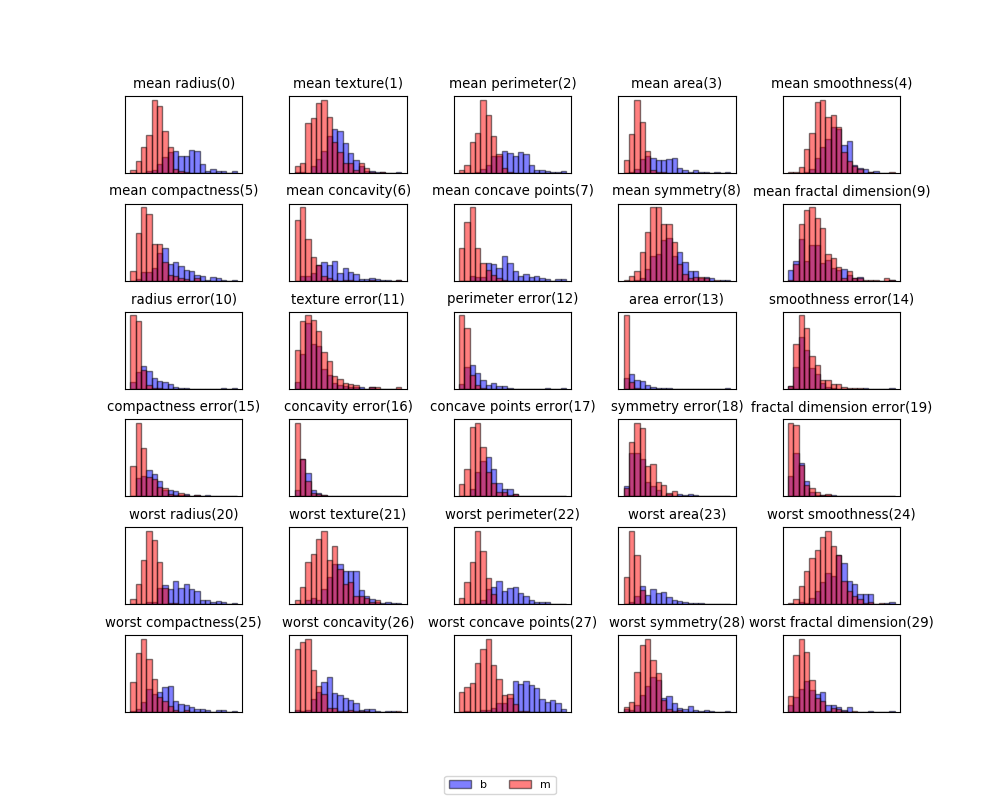
30個の特徴量について悪性と良性に色分けしてヒストグラムを描いてみると、特徴量によって悪性と良性がある程度分かれているものと、重なりが大きいものがあることがわかる。
特徴量の数は多いが、低い次元で見る限りは明確に悪性/良性を分離できる特徴量はあまり多くなさそうである。

|
1 2 3 4 5 6 7 8 9 10 11 12 13 14 15 16 17 18 19 20 21 22 23 24 25 26 27 28 29 30 31 32 33 34 |
import numpy as np import matplotlib.pyplot as plt from sklearn.datasets import load_breast_cancer cancer_ds = load_breast_cancer() X = cancer_ds.data y = cancer_ds.target feature_names = cancer_ds.feature_names target_names = cancer_ds.target_names fig, axs = plt.subplots(6, 5, figsize=(10.0, 8)) plt.rcParams['font.size'] = 8 fig.subplots_adjust(hspace=0.4, wspace=0.4) axs_1d = axs.reshape(1, -1)[0] for ax, feature in zip(axs_1d, range(len(feature_names))): xf = X[:, feature] range_min = np.min(xf) range_max = np.max(xf) ax.set_title("{}({})".format(feature_names[feature], feature)) ax.hist(xf[y==0], range=(range_min, range_max), bins=20, color='b', ec='k', alpha=0.5, label="b") ax.hist(xf[y==1], range=(range_min, range_max), bins=20, color='r', ec='k', alpha=0.5, label="m") ax.tick_params(left=False, bottom=False, labelleft=False, labelbottom=False) handler, label = axs_1d[0].get_legend_handles_labels() fig.legend(handler, label, ncol=2, loc='lower center') plt.show() |
2つの特徴量同士の関係
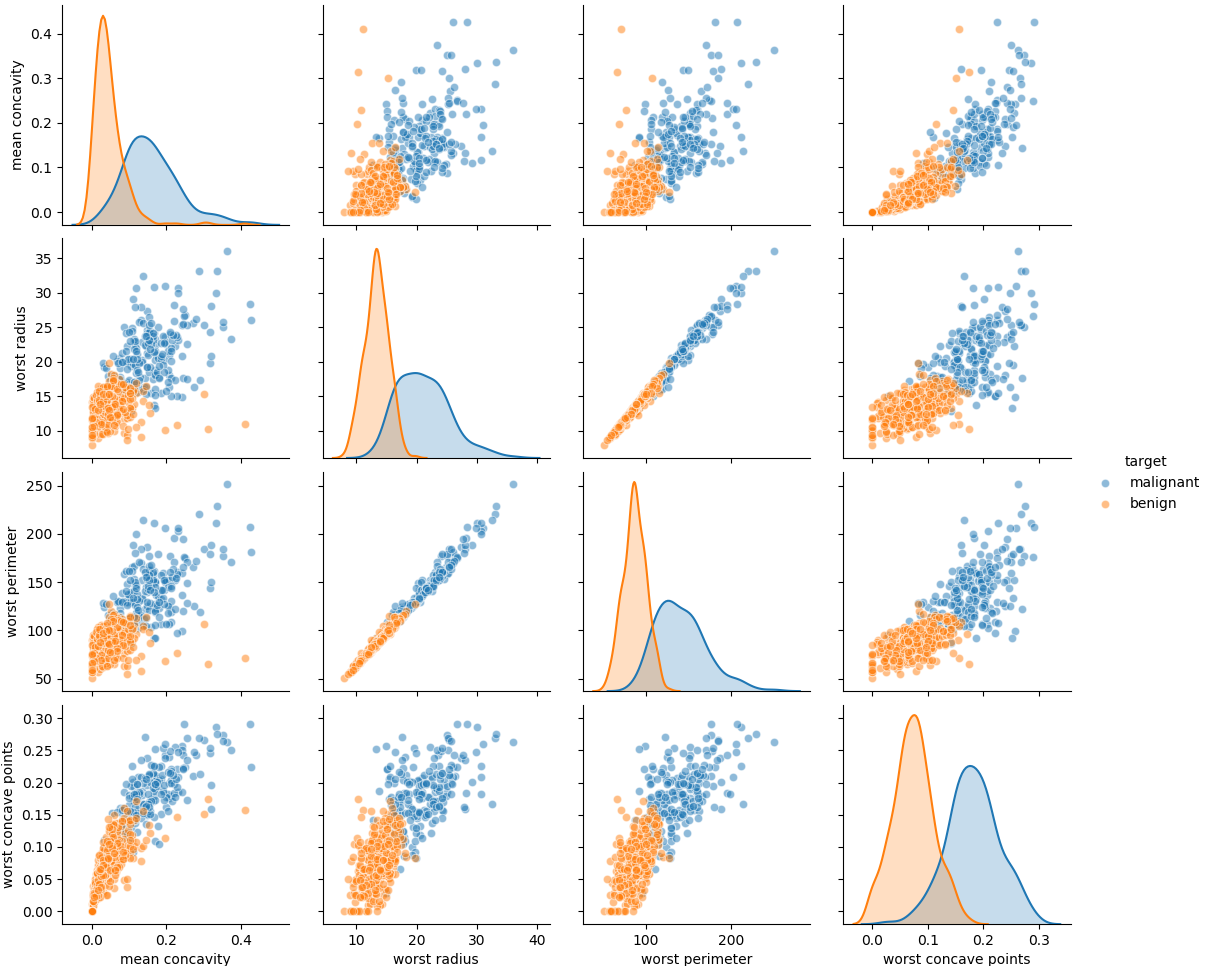
特徴量が30個あるので、scatter_matrixやpairplotで全ての特徴量の関係を見るのはあまり得策ではない。そこで、30個の特徴量の中から、悪性/良性が分かれているものを選んで相互の関係を見てみる。
ここでは、双方の分布の山ができるだけ離れており、重なっている部分が少ないものとして、平均凹度、最大半径、最大周囲長、最大凹点数を選んだ。
最大半径と最大周囲長はかなり相関が高く、双方を組み合わせてもあまり効果はなさそうだ。もともと半径と周囲長は円形なら比例関係にあるので当然の結果だろう。

|
1 2 3 4 5 6 7 8 9 10 11 12 13 14 15 16 17 18 19 20 21 22 23 24 25 26 27 28 29 30 31 32 33 34 35 36 |
import numpy as np import pandas as pd import matplotlib.pyplot as plt import seaborn as sns from sklearn.datasets import load_breast_cancer from mpl_toolkits.mplot3d import Axes3D cancer_ds = load_breast_cancer() X = cancer_ds.data y = cancer_ds.target feature_names = cancer_ds.feature_names target_names = cancer_ds.target_names X06 = X[:, 6].reshape(-1, 1) X20 = X[:, 20].reshape(-1, 1) X22 = X[:, 22].reshape(-1, 1) X27 = X[:, 27].reshape(-1, 1) X_new = np.hstack((X06, X20, X22, X27)) fname_new = np.array( [feature_names[6], feature_names[20], feature_names[22], feature_names[27]]) df = pd.DataFrame(X_new, columns=fname_new) df['target'] = cancer_ds.target df.loc[df['target']==0, 'target'] = "malignant" df.loc[df['target']==1, 'target'] = "benign" g = sns.pairplot(df, hue='target', plot_kws={'alpha':0.5}) fig = plt.figure() ax = fig.add_subplot(111, projection='3d') ax.scatter(X06[y==0], X20[y==0], X27[y==0], alpha=0.5, label="malignant") ax.scatter(X06[y==1], X20[y==1], X27[y==1], alpha=0.5, label="benign") ax.legend() plt.show() |
3つの特徴量の関係
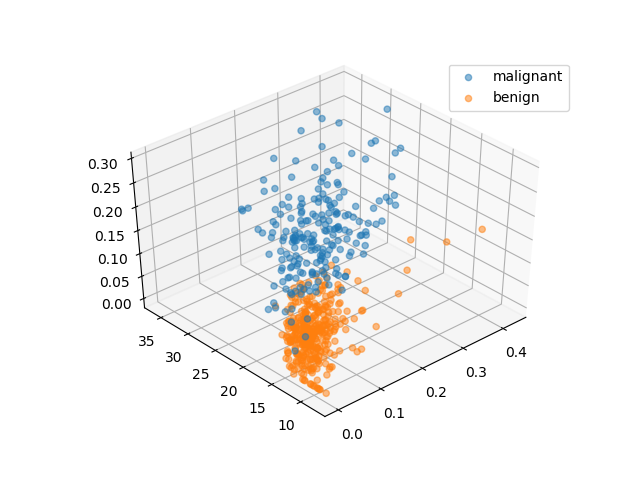
最後に、平均凹度、最大半径、最大凹点数の3つの特徴量の関係を3次元化してみた。結果の図を回転させて、できるだけ境界面に沿うような角度から見たのが以下の図である。個々の特徴量だけで見るよりはかなり分離の精度は高くなっている。

上記の3d可視化とその前のpairplotのコードは下記の通り。
|
1 2 3 4 5 6 7 8 9 10 11 12 13 14 15 16 17 18 19 20 21 22 23 24 25 26 27 28 29 30 31 32 33 34 35 36 |
import numpy as np import pandas as pd import matplotlib.pyplot as plt import seaborn as sns from sklearn.datasets import load_breast_cancer from mpl_toolkits.mplot3d import Axes3D cancer_ds = load_breast_cancer() X = cancer_ds.data y = cancer_ds.target feature_names = cancer_ds.feature_names target_names = cancer_ds.target_names X06 = X[:, 6].reshape(-1, 1) X20 = X[:, 20].reshape(-1, 1) X22 = X[:, 22].reshape(-1, 1) X27 = X[:, 27].reshape(-1, 1) X_new = np.hstack((X06, X20, X22, X27)) fname_new = np.array( [feature_names[6], feature_names[20], feature_names[22], feature_names[27]]) df = pd.DataFrame(X_new, columns=fname_new) df['target'] = cancer_ds.target df.loc[df['target']==0, 'target'] = "malignant" df.loc[df['target']==1, 'target'] = "benign" g = sns.pairplot(df, hue='target', plot_kws={'alpha':0.5}) fig = plt.figure() ax = fig.add_subplot(111, projection='3d') ax.scatter(X06[y==0], X20[y==0], X27[y==0], alpha=0.5, label="malignant") ax.scatter(X06[y==1], X20[y==1], X27[y==1], alpha=0.5, label="benign") ax.legend() plt.show() |