概要
scikit-learnのDecisionTreeClassificationモデルにfeature_importances_というパラメーターがある。このパラメーターは1次元配列で、特徴量番号に対する重要度が実数で格納されている。
このfeature_importances_について、公式ドキュメントでは以下のように書かれている。
The importance of a feature is computed as the (normalized) total reduction of the criterion brought by that feature. It is also known as the Gini importance.
~特徴量の重要度は、対象とする特徴量から得られた基準値の減少分の(正規化された)合計値。ジニ重要度としても知られている。~
と書かれているが、ちょっと曖昧で定義がはっきりしない。ジニ重要度というのは日本語サイトではなかなかヒットしないが、英語では結構取り上げられている。たとえばこちらのサイトでは以下のように引用説明されている。
It is sometimes called “gini importance” or “mean decrease impurity” and is defined as the total decrease in node impurity (weighted by the probability of reaching that node (which is approximated by the proportion of samples reaching that node)) averaged over all trees of the ensemble.
これを読むと、それはジニ重要度/平均不純度減少量と呼ばれ、ノードの不純度の減少分の重み付き和(重みはそのノードにたどり着いたサンプル数の比率)を決定木全体にわたって平均した値、となる。
定式化
あるノードの不純度をI(tP)、その左右の子ノードの不純度をI(tL), (tR)とし、それぞれのノードのサンプル数をnP, nL, nRとする(nP = nL + nR)。このとき、ノードtPの不純度の減少分の重み付き和は以下のようになる。
(1) ![]()
ここでNは全サンプル数。この値を決定木全体にわたって平均したものが特徴量重要度となるので、これをM(tP)とすると、以下のようになる。
(2) 
なお分母分子でNが共通なので、式(1)においてNで割らずに計算しても結果は同じになる。
以上から、特徴量重要度の計算は以下の手順となる。
- 決定木の葉ノードを除く各ノードについて以下を計算
- ノードの不純度とサンプル数を掛けた値(wI)を計算
- ノードのwIから、左右の子ノードのwIを減じた値gを計算
- 決定木全体のgの合計でこれを除した値を、そのノードの分割基準となった特徴量の特徴量重要度とする
feature_importances_の内容
この流れを、breast_cancerデータセットに対して以下のコードで確認してみる。パラメーターの設定はO’Reillyの”Pythonではじめる機械学習”の例に合わせていて、深さ4で事前刈込をしている。
|
1 2 3 4 5 6 7 8 9 10 11 12 13 14 15 16 17 18 19 20 21 22 23 |
import matplotlib.pyplot as plt from pandas import DataFrame from sklearn.model_selection import train_test_split from sklearn.datasets import load_breast_cancer from sklearn.tree import DecisionTreeClassifier ds = load_breast_cancer() X_train, X_test, y_train, y_test =\ train_test_split(ds.data, ds.target, stratify=ds.target, random_state=42) clf = DecisionTreeClassifier(max_depth=4, random_state=0) clf.fit(X_train, y_train) print(clf.feature_importances_) df = DataFrame( {'feature':ds.feature_names, 'importance':clf.feature_importances_}) print(df) fig, ax = plt.subplots() fig.subplots_adjust(left=0.3) ax.barh(df.feature, df.importance) plt.show() |
まず、この決定木のfeature_importances_パラメーターそのものの内容は以下の通り。すべての値を合計すると1.0となる。
|
1 2 3 4 5 |
[0. 0. 0. 0. 0. 0. 0. 0. 0. 0. 0.01019737 0.04839825 0. 0. 0.0024156 0. 0. 0. 0. 0. 0.72682851 0.0458159 0. 0. 0.0141577 0. 0.018188 0.1221132 0.01188548 0. ] |
また、pandas.DataFrameで特徴量名と併せて表示すると以下の通り。
|
1 2 3 4 5 6 7 8 9 10 11 12 13 14 15 16 17 18 19 20 21 22 23 24 25 26 27 28 29 30 31 |
feature importance 0 mean radius 0.000000 1 mean texture 0.000000 2 mean perimeter 0.000000 3 mean area 0.000000 4 mean smoothness 0.000000 5 mean compactness 0.000000 6 mean concavity 0.000000 7 mean concave points 0.000000 8 mean symmetry 0.000000 9 mean fractal dimension 0.000000 10 radius error 0.010197 11 texture error 0.048398 12 perimeter error 0.000000 13 area error 0.000000 14 smoothness error 0.002416 15 compactness error 0.000000 16 concavity error 0.000000 17 concave points error 0.000000 18 symmetry error 0.000000 19 fractal dimension error 0.000000 20 worst radius 0.726829 21 worst texture 0.045816 22 worst perimeter 0.000000 23 worst area 0.000000 24 worst smoothness 0.014158 25 worst compactness 0.000000 26 worst concavity 0.018188 27 worst concave points 0.122113 28 worst symmetry 0.011885 29 worst fractal dimension 0.000000 |
特徴量重要度の計算過程
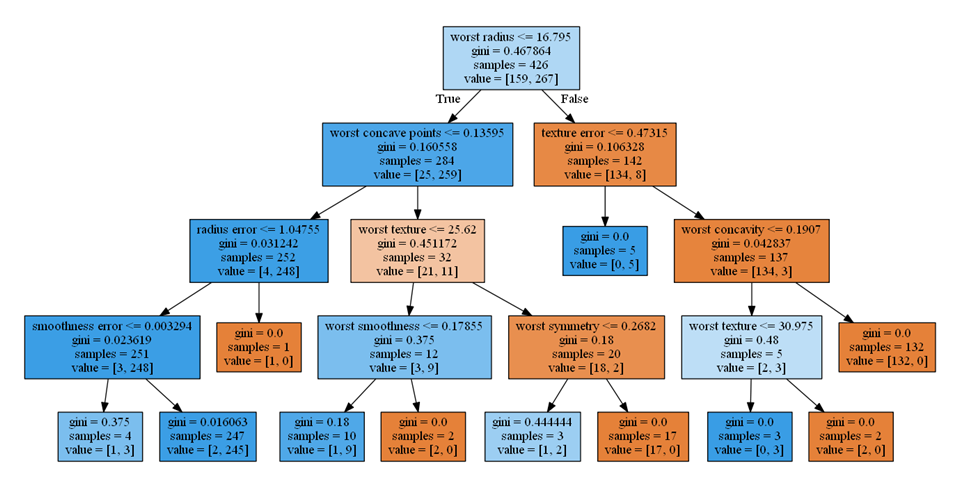
特徴量重要度の計算過程を視覚的に追ってみる。まず深さ4までの決定木をgraphvizで視覚化すると以下の通り。

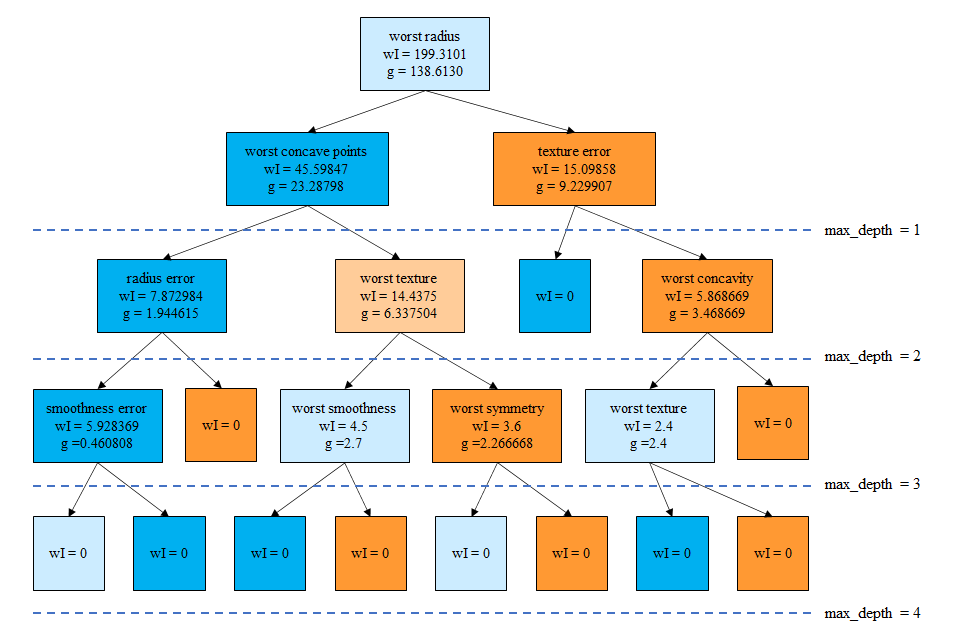
この決定木の葉以外のノードについて、gini不純度とサンプル数を掛け合わせた値をwIとして決定木を描きなおすと以下のとおり。また、gは着目するノードとその左右の子ノードのwIの差で、総サンプル数で無次元化しない重みによる情報利得と等価。
(3) ![]()

まずmax_depth=1のとき、worst radiusについてg = 138.6130となり、特徴量重要度はこの1つに対して1となる。
次にmax_depth=2とすると、3つのノードについて特徴量とgの値、重要度は以下の通り。
| 特徴量 | g | 重要度 |
| worst radius | 138.6130 | 0.809982 |
| wors concave points | 23.28798 | 0.136083 |
| texture error | 9.229907 | 0.053935 |
| 171.13089 | 1 |
実際の計算結果は以下の通りで符合している。
|
1 2 3 4 5 6 7 8 9 10 11 12 13 14 15 16 17 18 19 20 21 22 23 24 25 26 27 28 29 30 31 |
feature importance 0 mean radius 0.000000 1 mean texture 0.000000 2 mean perimeter 0.000000 3 mean area 0.000000 4 mean smoothness 0.000000 5 mean compactness 0.000000 6 mean concavity 0.000000 7 mean concave points 0.000000 8 mean symmetry 0.000000 9 mean fractal dimension 0.000000 10 radius error 0.000000 11 texture error 0.053935 12 perimeter error 0.000000 13 area error 0.000000 14 smoothness error 0.000000 15 compactness error 0.000000 16 concavity error 0.000000 17 concave points error 0.000000 18 symmetry error 0.000000 19 fractal dimension error 0.000000 20 worst radius 0.809981 21 worst texture 0.000000 22 worst perimeter 0.000000 23 worst area 0.000000 24 worst smoothness 0.000000 25 worst compactness 0.000000 26 worst concavity 0.000000 27 worst concave points 0.136084 28 worst symmetry 0.000000 29 worst fractal dimension 0.000000 |
同じように計算していき、max_depth=4の時は以下の通り。ただしここで、worst textureが2回登場していることに注意。1つ目は深さ2の左から2番目、もう1つは深さ3の右から2番目で、それぞれのノードが分割されたときのクラスは異なっている。worst textureの重要度を計算する際には、この2つのgを加えている。
| 特徴量 | g | 重要度 |
| worst radius | 138.6130 | 0.726829 |
| worst concave points | 23.28798 | 0.122113 |
| texture error | 9.229907 | 0.048398 |
| radius error | 1.944615 | 0.010197 |
| worst texture | 8.737504 | 0.045816 |
| worst concavity | 3.168669 | 0.018188 |
| smoothness error | 0.460808 | 0.002416 |
| worst smoothness | 2.7 | 0.001416 |
| worst symmetry | 2.266668 | 0.011885 |
| 190.7091 | 1 |
実際の計算結果は以下の通りで符合している。
|
1 2 3 4 5 6 7 8 9 10 11 12 13 14 15 16 17 18 19 20 21 22 23 24 25 26 27 28 29 30 31 |
feature importance 0 mean radius 0.000000 1 mean texture 0.000000 2 mean perimeter 0.000000 3 mean area 0.000000 4 mean smoothness 0.000000 5 mean compactness 0.000000 6 mean concavity 0.000000 7 mean concave points 0.000000 8 mean symmetry 0.000000 9 mean fractal dimension 0.000000 10 radius error 0.010197 11 texture error 0.048398 12 perimeter error 0.000000 13 area error 0.000000 14 smoothness error 0.002416 15 compactness error 0.000000 16 concavity error 0.000000 17 concave points error 0.000000 18 symmetry error 0.000000 19 fractal dimension error 0.000000 20 worst radius 0.726829 21 worst texture 0.045816 22 worst perimeter 0.000000 23 worst area 0.000000 24 worst smoothness 0.014158 25 worst compactness 0.000000 26 worst concavity 0.018188 27 worst concave points 0.122113 28 worst symmetry 0.011885 29 worst fractal dimension 0.000000 |