概要
決定木を回帰に用いる場合、回帰木(regression tree)とも呼ぶ。ここでは決定木の回帰における性質・挙動を確認する。
回帰木の学習過程
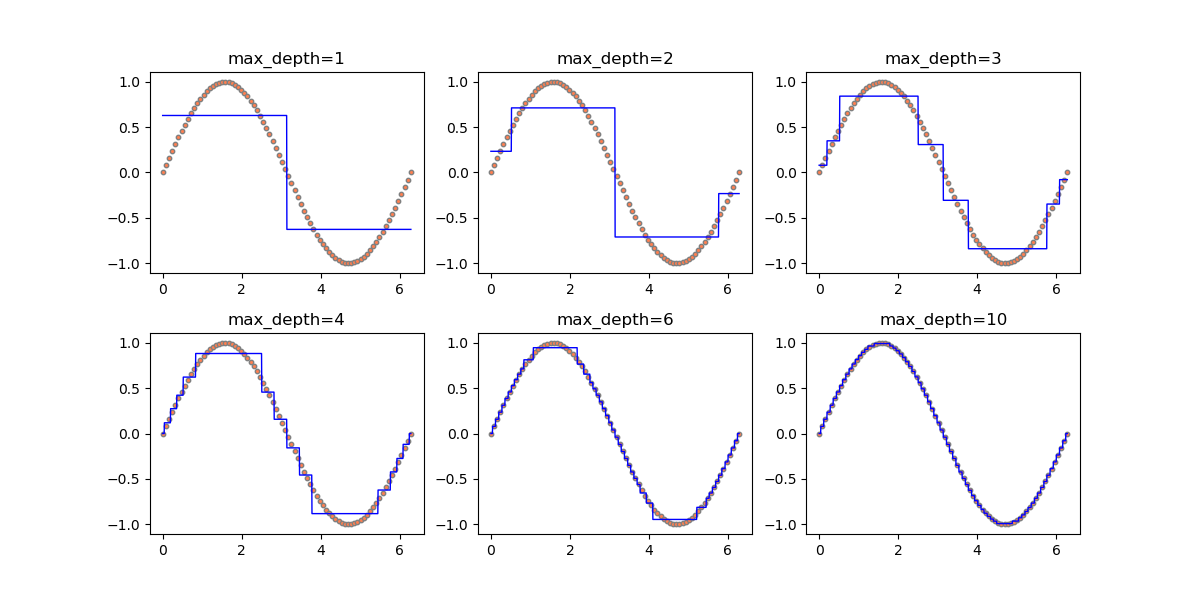
以下は、sin関数に対して回帰木を適用し、剪定の深さを深くしていった場合の推移。
剪定深さ1の場合、特徴量を2つに分割しそれぞれの領域のデータから学習し予測値を得ている。剪定深さ2の場合、さらに各領域を2分割して4つの領域で予測値を得ている。このようにして剪定深さnに対して2nの領域のデータで学習する。この例の場合は訓練セットとして80個のデータを準備し、1000個のデータの予測をしている。
剪定深さ6で26=64訓練セットの個数と近くなるが、サインカーブの山と谷のところで区間が長く、誤差が出ている。これは、回帰木のノード分割がy = sin xの値に基づいて行われるとき、その値がかなり近くなる山・谷のところでなかなか分離されないからと考えられる。
剪定深さ10で210=1024のとき、分割数がテストセットと同じくらいの数になるので初めて値が近い点も区別され、全体がフィットする。
|
1 2 3 4 5 6 7 8 9 10 11 12 13 14 15 16 17 18 19 20 21 22 23 24 25 26 |
import numpy as np import matplotlib.pyplot as plt from pandas import DataFrame from sklearn.tree import DecisionTreeRegressor x_train = np.linspace(0, np.pi * 2, num=80) y_train = np.sin(x_train).reshape(-1, 1) X_train = x_train.reshape(-1, 1) x_test = np.linspace(0, np.pi * 2, num=1000).reshape(-1, 1) X_test = x_test.reshape(-1, 1) depths = [1, 2, 3, 4, 6, 10] fig, axs = plt.subplots(2, 3, figsize=(12, 6)) fig.subplots_adjust(hspace=0.3) ax_1d = axs.reshape(-1) for ax, depth in zip(ax_1d, depths): ax.scatter(x_train, y_train, s=10, ec='gray', fc="coral") treereg = DecisionTreeRegressor(max_depth=depth).fit(X_train, y_train) y_pred = treereg.predict(X_test) ax.plot(x_test, y_pred, c='blue', linewidth=1) ax.set_title("max_depth={}".format(depth)) plt.show() |
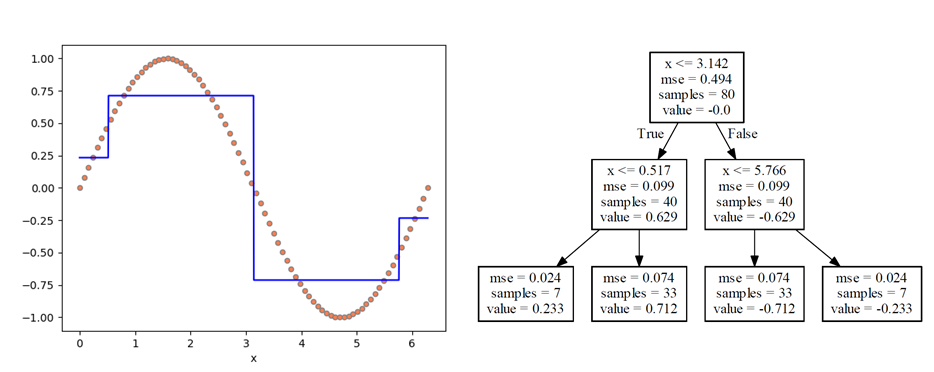
ここで、学習途上の状況を、剪定深さ2(max_depth=2)の時の状態で確認してみる。
分割された4つの領域に対する境界(0.517, 3.142, 5.766)のうち、最初の境界3.142はπの値で、0~2πの領域においてπの両側で対称なことから自然な結果。4つの領域における予測値(value)はグラフ上でも確認でき、やはりπの両側で対称な値となっている。
|
1 2 3 4 5 6 7 8 9 10 11 12 13 14 15 16 17 18 19 20 21 22 23 24 25 |
import numpy as np import matplotlib.pyplot as plt import graphviz from sklearn.tree import DecisionTreeRegressor, export_graphviz x_train = np.linspace(0, np.pi * 2, num=80) y_train = np.sin(x_train) X_train = x_train.reshape(-1, 1) treereg = DecisionTreeRegressor(max_depth=2).fit(X_train, y_train) x_test = np.linspace(0, np.pi * 2, num=1000) X_test = x_test.reshape(-1, 1) y_pred = treereg.predict(X_test) dot_data = export_graphviz(treereg, out_file=None, feature_names=["x"], class_names=["sin"]) graph = graphviz.Source(dot_data) graph.render("image", view=True) fig, ax = plt.subplots() ax.scatter(x_train, y_train, s=20, ec='gray', fc="coral") ax.plot(X_test, y_pred, c='blue') ax.set_xlabel("x") plt.show() |
ノイズの影響と過学習
先のサインカーブにノイズが乗った場合の回帰木を見てみる。剪定深さ3、5としたときの回帰木による回帰線の形は以下の通りで、深さが深いと個別のデータに対して過学習となっている様子がわかる。
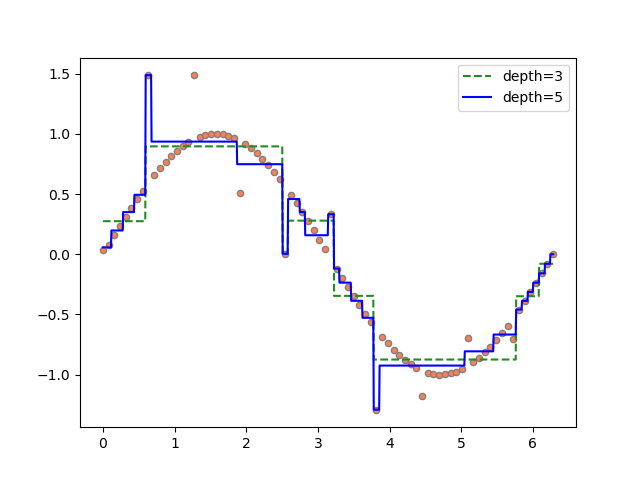
これらのモデルのスコアは以下の通りで、深さ5の場合には訓練スコアに対してテストスコアが低く、過学習となっている。
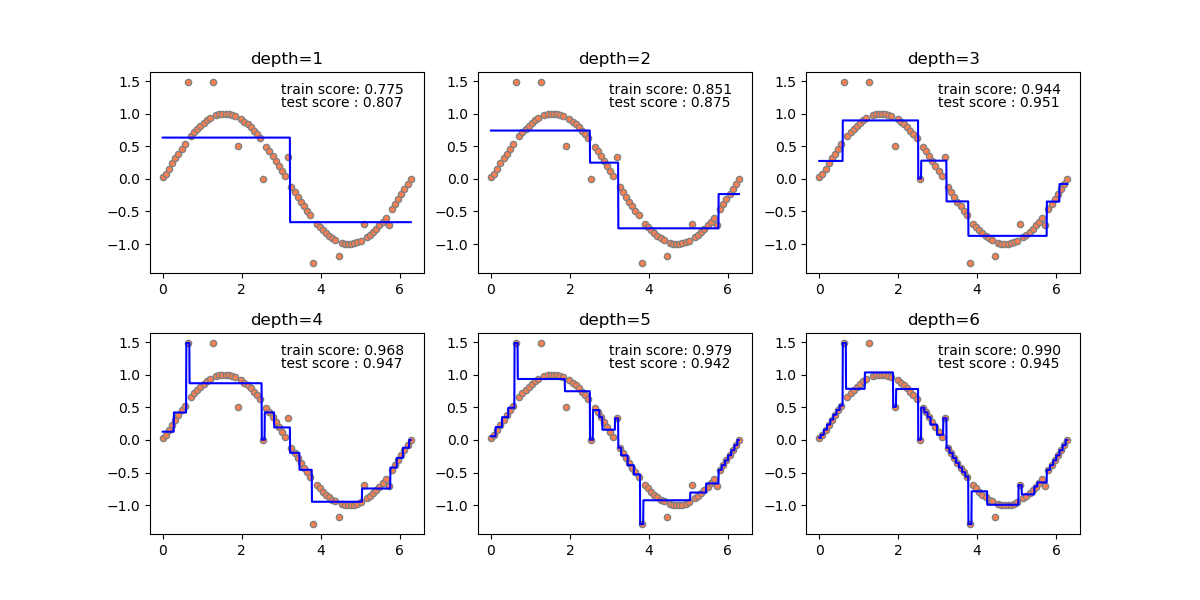
深さ3の場合に訓練スコアの方がテストスコアより低いが、これは訓練スコアにノイズが含まれるのに対してテストスコアのyの値をすべてノイズがないsin値としているためで、訓練セットにおいて乱数を加える程度を小さくするとこの逆転現象は解消される。
|
1 2 3 4 5 6 |
depth=3 training score: 0.944 test score : 0.951 depth=5 training score: 0.979 test score : 0.942 |
上記の実行コードは以下の通り。
|
1 2 3 4 5 6 7 8 9 10 11 12 13 14 15 16 17 18 19 20 21 22 23 24 25 26 27 28 29 30 31 32 33 34 35 36 37 38 39 40 41 42 43 44 45 46 47 48 49 |
import numpy as np import numpy.random as rnd import matplotlib.pyplot as plt from pandas import DataFrame from sklearn.tree import DecisionTreeRegressor n_train = 80 n_rand = 10 depth1 = 3 depth2 = 5 rnd.seed(23) x = np.linspace(0, np.pi * 2, num=n_train) y = np.sin(x) for i in range(0, len(x), n_train//n_rand): y[i] = y[i] + (rnd.rand() * 2 - 1) df = DataFrame(x, columns=['x']) df['y'] = y x_train = np.array(df['x']) y_train = np.array(df['y']) X_train = x_train.reshape(-1, 1) treereg1 = DecisionTreeRegressor(max_depth=depth1).fit(X_train, y_train) treereg2 = DecisionTreeRegressor(max_depth=depth2).fit(X_train, y_train) x_test = np.linspace(0, np.pi * 2, 1000) y_test = np.sin(x_test) X_test = x_test.reshape(-1, 1) y_pred1 = treereg1.predict(X_test) y_pred2 = treereg2.predict(X_test) print("depth={}".format(depth1)) print(" training score:{:6.3f}".format(treereg1.score(X_train, y_train))) print(" test score :{:6.3f}".format(treereg1.score(X_test, y_test))) print("depth={}".format(depth2)) print(" training score:{:6.3f}".format(treereg2.score(X_train, y_train))) print(" test score :{:6.3f}".format(treereg2.score(X_test, y_test))) fig, ax = plt.subplots() ax.scatter(x_train, y_train, s=20, ec='gray', fc="coral") ax.plot(X_test, y_pred1, c='forestgreen', linestyle='dashed', label="depth={}".format(depth1)) ax.plot(X_test, y_pred2, c='blue', label="depth={}".format(depth2)) ax.legend() plt.show() |
同じデータで決定木の剪定深さを変えていったときの状況を如何に示す。訓練スコアとテストスコアの関係から、深さ3までは学習不足、深さ4以降は過学習となっていることが示され、過学習になるとノイズの影響を受けていることがわかる。
決定木の限界~外挿
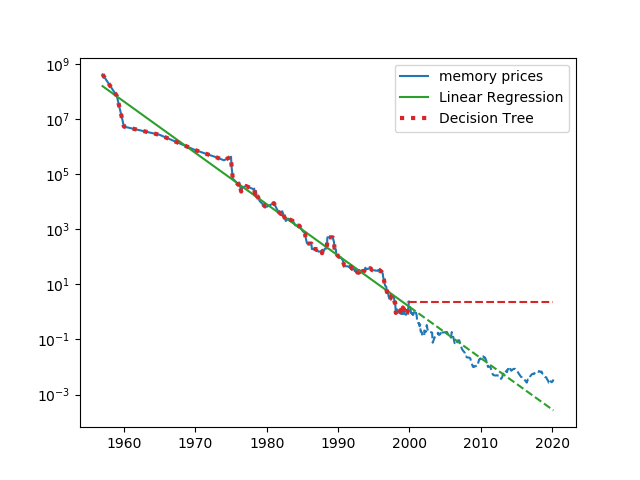
決定木は、与えられた訓練データに対しては完全な予測も可能だが、訓練データの領域外のデータに対しては妥当な予測ができない。書籍”Pythonではじめる機械学習”で紹介されている、メモリー単価の推移によってこれを確認する(データについてはこちらのサイトのものを使わせてもらった)。
時間をx、メモリー単価をyとするとメモリー単価を対数で表したlog yはxに対して概ね線形関係になっている。以下は、縦軸を対数目盛とした場合のメモリー単価、xとlog yについて線形回帰と決定木による学習と予測の結果を示したもので、2000年より前のデータによって双方のモデルを学習させ、2000年以降の価格を予測している。
線形回帰はデータの細かい傾向は再現できないが、訓練セットの外側についてもその傾向をある程度予測できている。一方決定木については、訓練セットについては完全に予測しているが、その外側になった途端に、外側の直前のデータの値をそのまま予測値としている。
|
1 2 3 4 5 6 7 8 9 10 11 12 13 14 15 16 17 18 19 20 21 22 23 24 25 26 27 28 29 30 31 32 33 34 35 36 37 38 39 40 41 |
import os import numpy as np import pandas as pd import matplotlib.pyplot as plt from sklearn.linear_model import LinearRegression from sklearn.tree import DecisionTreeRegressor data_path = \ r"C:\Users\tomo\GoogleDrive\IT_and_Mobile\dev\python\Machine_Learning" memory_prices = \ pd.read_csv(os.path.join(data_path, r"regression_tree\memory_prices.csv")) data_train = memory_prices[memory_prices.date < 2000] data_test = memory_prices[memory_prices.date >= 2000] x_train = np.array(data_train.date) x_test = np.array(data_test.date) y_train = np.array(data_train.price) y_test = np.array(data_test.price) X_train = x_train.reshape(-1, 1) X_test = x_test.reshape(-1, 1) linreg = LinearRegression().fit(X_train, np.log(y_train)) y_pred_linreg_train = np.exp(linreg.predict(X_train)) y_pred_linreg_test = np.exp(linreg.predict(X_test)) treereg = DecisionTreeRegressor().fit(X_train, np.log(y_train)) y_pred_treereg_train = np.exp(treereg.predict(X_train)) y_pred_treereg_test = np.exp(treereg.predict(X_test)) fig, ax = plt.subplots() ax.plot(data_train.date, data_train.price, c='tab:blue', label="memory prices") ax.plot(data_test.date, data_test.price, c='tab:blue', linestyle='dashed') ax.plot(x_train, y_pred_linreg_train, c='tab:green', label="Linear Regression") ax.plot(x_test, y_pred_linreg_test, c='tab:green', linestyle='dashed') ax.plot(x_train, y_pred_treereg_train, c='tab:red', linestyle='dotted', linewidth=3, label="Decision Tree") ax.plot(x_test, y_pred_treereg_test, c='tab:red', linestyle='dashed') ax.set_yscale('log') ax.legend() plt.show() |