概要
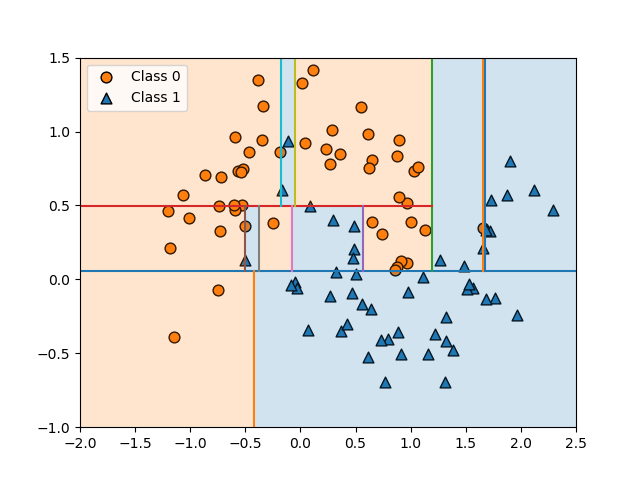
書籍”Pythonではじめる機械学習”の決定木のところで、ノードの分割をするごとの境界を描いている。

書籍ではmglearnパッケージを使っているが、これを自前の関数で再現した例。
|
1 2 3 4 5 6 7 8 9 10 11 12 13 14 15 16 17 18 19 20 21 22 23 24 25 26 27 28 29 30 31 32 33 34 35 36 37 38 39 40 41 42 43 44 45 46 47 48 49 50 51 52 53 54 55 56 57 58 59 60 61 62 63 64 65 66 |
import numpy as np import matplotlib.pyplot as plt import matplotlib.patches as patch from sklearn.datasets import make_moons from sklearn.tree import DecisionTreeClassifier def draw_tree_boundary(tree, ax, left, right, bottom, top, i_node=0, stop_level=None, n_level=0): if tree.children_left[i_node] == -1 or stop_level == n_level: fc =\ 'tab:orange' if np.argmax(tree.value[i_node][0])==0 else 'tab:blue' rect = patch.Rectangle(xy=(left, bottom), width=right-left, height=top-bottom, fc=fc, alpha=0.2) ax.add_patch(rect) return if tree.feature[i_node] == 0: f0 = tree.threshold[i_node] ax.plot([f0, f0], [top, bottom]) draw_tree_boundary(tree=tree, ax=ax, left=left, right=f0, top=top, bottom=bottom, i_node=tree.children_left[i_node], stop_level=stop_level, n_level=n_level+1,) draw_tree_boundary(tree=tree, ax=ax, left=f0, right=right, top=top, bottom=bottom, i_node=tree.children_right[i_node], stop_level=stop_level, n_level=n_level+1) else: f1 = tree.threshold[i_node] ax.plot([left, right], [f1, f1]) draw_tree_boundary(tree=tree, ax=ax, left=left, right=right, top=f1, bottom=bottom, i_node=tree.children_left[i_node], stop_level=stop_level, n_level=n_level+1) draw_tree_boundary(tree=tree, ax=ax, left=left, right=right, top=top, bottom=f1, i_node=tree.children_right[i_node], stop_level=stop_level, n_level=n_level+1) X, y = make_moons(n_samples=100, noise=0.25, random_state=3) treeclf = \ DecisionTreeClassifier(max_depth=None, min_samples_leaf=1, random_state=0) treeclf.fit(X, y) fig, ax = plt.subplots() ax.scatter(X[y==0][:, 0], X[y==0][:, 1], ec='k', s=60, marker='o', fc='tab:orange', label="Class 0") ax.scatter(X[y==1][:, 0], X[y==1][:, 1], ec='k', s=60, marker='^', fc='tab:blue', label="Class 1") x0_min, x0_max = -2, 2.5 x1_min, x1_max = -1, 1.5 draw_tree_boundary(tree=treeclf.tree_, i_node=0, ax=ax, left=x0_min, right=x0_max, bottom=x1_min, top=x1_max) ax.set_xlim(x0_min, x0_max) ax.set_ylim(x1_min, x1_max) ax.legend() plt.show() |
関数の仕様
描画用の関数draw_tree_boundary()の引数は以下の通り。
draw_tree_boundary(tree, ax, left, right, bottom, top, i_node=0, stop_level=None, n_level=0)
tree- 描きたい決定木モデルのtree_オブジェクトを渡す。
ax- 境界図を描くターゲットの
Axesオブジェクトを渡す。 left, right, bottom, top- その時点でのノードの描画範囲をaxに即した座標で指定する。
i_node- エリアを描画するノード。省略した場合のデフォルトは0で、ルートノード(全域)以下を描画。
stop_level- 描画する木の深さを指定。デフォルトは
Noneで、この場合は最深部まで描く。 n_level- この関数の再帰呼び出しの際に内部的に使われる。
この関数を呼び出し方の例は以下の通りで、stop_levelを省略しているので、リーフノードまで含めた木全体を描いている。
|
1 2 3 4 5 6 7 8 9 10 11 12 13 14 15 16 17 18 19 20 21 22 23 24 |
X, y = make_moons(n_samples=100, noise=0.25, random_state=3) treeclf = \ DecisionTreeClassifier(max_depth=None, min_samples_leaf=1, random_state=0) treeclf.fit(X, y) fig, ax = plt.subplots() ax.scatter(X[y==0][:, 0], X[y==0][:, 1], ec='k', s=60, marker='o', fc='tab:orange', label="Class 0") ax.scatter(X[y==1][:, 0], X[y==1][:, 1], ec='k', s=60, marker='^', fc='tab:blue', label="Class 1") x0_min, x0_max = -2, 2.5 x1_min, x1_max = -1, 1.5 draw_tree_boundary(tree=treeclf.tree_, i_node=0, ax=ax, left=x0_min, right=x0_max, bottom=x1_min, top=x1_max) ax.set_xlim(x0_min, x0_max) ax.set_ylim(x1_min, x1_max) ax.legend() plt.show() |
関数の処理内容
この関数の大まかな処理の流れは、以下の通り。
- ルートノードの分割から初めて、リーフノードに行きつくまで分割と下の階層の探索を再帰的に進める
- リーフノードであればそのノードのクラスで色を塗り、親のノードに戻る
- あるノードの左の子ノードの下のリーフノードの処理が全部終わったら、右の子ノードの処理に移り、それも終わったら親のノードに戻る
関数の処理内容を最初の呼び出しから追うと以下の通り。
i_nodeとstop_levelを省略して呼び出し→ルートノードから木全体を描く- 現在のノードがリーフノード(子ノードのインデックスが–1)あるいは現在の深さが
stop_levelに達したなら、以下を実行してreturn(親ノードに戻る)- 現在のノードの卓越クラスに応じて
tab:orangeかtab:blueでフェイスカラーを設定 - 引数で得られた矩形領域をフェイスカラーで塗りつぶす
- 塗りつぶした矩形を
axに追加
- 現在のノードの卓越クラスに応じて
- 現在のノードがリーフノードでなく、終了深さにも達していない場合は、現在のノードを分割する特徴量によって以下を実行してreturn(親ノードに戻る)
- ノードの分割基準が特徴量0の場合
- 分割基準の特徴量0の値で領域の上から下まで境界線を引く
- 左側のエリアを指定して左子ノードを処理する
- 戻ってきたら右側のエリアを指定して右子ノードを処理する
- ノードの分割基準が特徴量1の場合
- 分割基準の特徴量1の値で領域の左から右まで境界線を引く
- 下側のエリアを指定して左子ノードを処理する
- 戻ってきたら上側のエリアを指定して右子ノードを処理する
- ノードの分割基準が特徴量0の場合
|
1 2 3 4 5 6 7 8 9 10 11 12 13 14 15 16 17 18 19 20 21 22 23 24 25 26 27 28 29 30 31 32 33 |
def draw_tree_boundary(tree, ax, left, right, bottom, top, i_node=0, stop_level=None, n_level=0): if tree.children_left[i_node] == -1 or stop_level == n_level: fc =\ 'tab:orange' if np.argmax(tree.value[i_node][0])==0 else 'tab:blue' rect = patch.Rectangle(xy=(left, bottom), width=right-left, height=top-bottom, fc=fc, alpha=0.2) ax.add_patch(rect) return if tree.feature[i_node] == 0: f0 = tree.threshold[i_node] ax.plot([f0, f0], [top, bottom]) draw_tree_boundary(tree=tree, ax=ax, left=left, right=f0, top=top, bottom=bottom, i_node=tree.children_left[i_node], stop_level=stop_level, n_level=n_level+1,) draw_tree_boundary(tree=tree, ax=ax, left=f0, right=right, top=top, bottom=bottom, i_node=tree.children_right[i_node], stop_level=stop_level, n_level=n_level+1) else: f1 = tree.threshold[i_node] ax.plot([left, right], [f1, f1]) draw_tree_boundary(tree=tree, ax=ax, left=left, right=right, top=f1, bottom=bottom, i_node=tree.children_left[i_node], stop_level=stop_level, n_level=n_level+1) draw_tree_boundary(tree=tree, ax=ax, left=left, right=right, top=top, bottom=f1, i_node=tree.children_right[i_node], stop_level=stop_level, n_level=n_level+1) |