概要
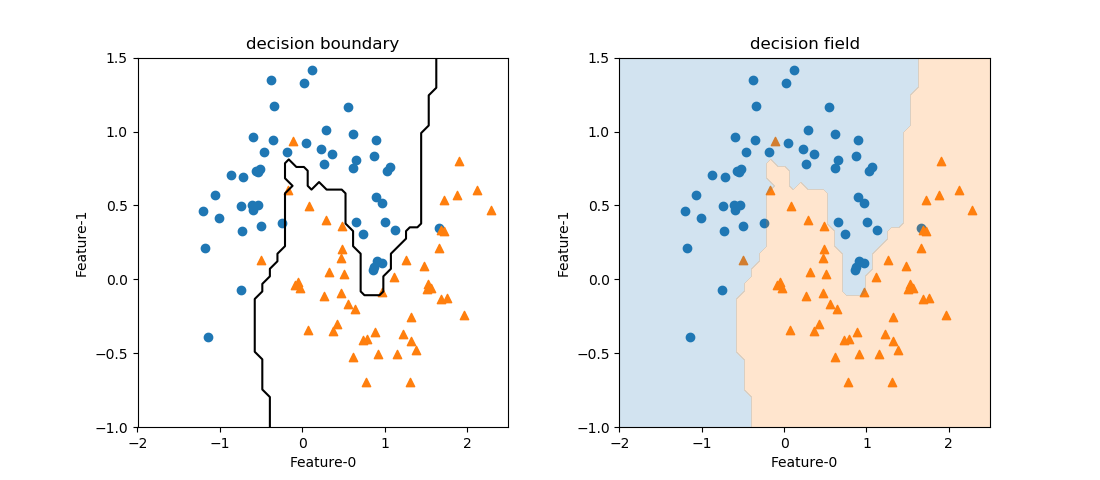
2つの特徴量を持つデータセットを学習したモデルに対し、2次元の特徴量空間における決定境界やクラス分類の分布を描く関数の例。
draw_decision_boundary()で決定境界の線を描き、draw_decision_area()で領域のクラス分布を色分けで表示する。

|
1 2 3 4 5 6 7 8 9 10 11 12 13 14 15 16 17 18 19 20 21 22 23 24 25 26 27 28 29 30 31 32 33 34 35 36 37 38 39 40 41 42 43 44 45 46 47 48 49 50 51 52 53 54 55 56 57 58 59 60 61 62 |
import numpy as np import matplotlib.pyplot as plt import matplotlib.patches as patch from sklearn.datasets import make_moons from sklearn.neighbors import KNeighborsClassifier def draw_decision_boundary(clf, ax, x0s, x1s, threshold=0, color='k', alpha=1.0): y_predicted = np.empty((len(x1s), len(x0s))) for row, x1 in enumerate(x1s): for col, x0 in enumerate(x0s): y_predicted[row, col] = clf.predict(np.array([[x0, x1]])) ax.contour(x0s, x1s, y_predicted, colors=color, levels=[threshold] , alpha=alpha) def draw_decision_field(clf, ax, x0s, x1s, n_areas=2, colors=['tab:blue', 'tab:orange'], alpha=0.5, fill=True): y_predicted = np.empty((len(x1s), len(x0s))) for row, x1 in enumerate(x1s): for col, x0 in enumerate(x0s): y_predicted[row, col] = clf.predict(np.array([[x0, x1]])) ax.contourf(x0s, x1s, y_predicted, colors=colors, levels=n_areas-1, alpha=alpha) X, y = make_moons(n_samples=100, noise=0.25, random_state=3) x0_min, x0_max = -2.0, 2.5 x1_min, x1_max = -1.0, 1.5 x0s = np.linspace(x0_min, x0_max, 50) x1s = np.linspace(x1_min, x1_max, 50) fig, axs = plt.subplots(1, 2, figsize=(11, 4.8)) fig.subplots_adjust(wspace=0.3) axs_1d = axs.reshape(-1) knn = KNeighborsClassifier(n_neighbors=3) knn.fit(X, y) for ax in axs_1d: ax.scatter(X[y==0][:, 0], X[y==0][:, 1], marker='o') ax.scatter(X[y==1][:, 0], X[y==1][:, 1], marker='^') ax.set_xlim(x0_min, x0_max) ax.set_ylim(x1_min, x1_max) ax.set_xlabel("Feature-0") ax.set_ylabel("Feature-1") draw_decision_boundary(knn, axs[0], x0s, x1s, threshold=0.5) draw_decision_field(knn, axs[1], x0s, x1s, alpha=0.2) axs[0].set_title("decision boundary") axs[1].set_title("decision field") plt.show() |
関数の使い方
それぞれの関数単体では特にパッケージは必要ないが、いくつかのパラメーターは一定のクラスを想定している。
draw_decision_boundary()
draw_decision_boundary(clf, ax, x0s, x1s, threshold, color, alpha)
clf- 学習済みのクラス分類モデルのインスタンスを指定する。
predict()メソッドを持つこと(引数は2次元配列を想定)。 ax- 決定境界を描く
Axesオブジェクト。 x0s, x1s- クラスを計算する領域の計算点の座標を1次元配列で指定。
threshold- 決定境界の値を整数で与える。デフォルトは0。決定値がクラスラベル(例えば0と1)で与えられる場合はその平均(たとえば0.5)を与える。
color- 決定境界の場合はカラーコード。デフォルトは’k’(黒)
alpha- 分布図の場合の塗りつぶしの透明度を実数で指定。デフォルトは1(不透明)
draw_decision_field()
draw_decision_field(clf, ax, x0s, x1s, n_areas=2, colors, alpha)
clf- 学習済みのクラス分類モデルのインスタンスを指定する。
predict()メソッドを持つこと(引数は2次元配列を想定)。 ax- 決定境界を描く
Axesオブジェクト。 x0s, x1s- クラスを計算する領域の計算点の座標を1次元配列で指定。
n_areas- 分割される領域の数を整数で指定。デフォルトは2(2つの領域)
colors- 分割される領域を塗りつぶす色をカラーコードの配列で与える。デフォルトは
['tab:blue', 'tab:oranbe']。 alpha- 分布図の場合の塗りつぶしの透明度を実数で指定。デフォルトは0.5(半透明)。
関数の内容
draw_decision_boundary()
pyplotのcontourを利用している。
|
1 2 3 4 5 6 7 8 9 10 11 |
def draw_decision_boundary(clf, ax, x0s, x1s, threshold=0, color='k', alpha=1.0): y_predicted = np.empty((len(x1s), len(x0s))) for row, x1 in enumerate(x1s): for col, x0 in enumerate(x0s): y_predicted[row, col] = clf.predict(np.array([[x0, x1]])) ax.contour(x0s, x1s, y_predicted, colors=color, levels=[threshold] , alpha=alpha) |
draw_decision_field()
pyplotのcontourfを利用している。
|
1 2 3 4 5 6 7 8 9 10 |
def draw_decision_field(clf, ax, x0s, x1s, n_areas=2, colors=['tab:blue', 'tab:orange'], alpha=0.5, fill=True): y_predicted = np.empty((len(x1s), len(x0s))) for row, x1 in enumerate(x1s): for col, x0 in enumerate(x0s): y_predicted[row, col] = clf.predict(np.array([[x0, x1]])) ax.contourf(x0s, x1s, y_predicted, colors=colors, levels=n_areas-1, alpha=alpha) |