概要
O’REILLYの書籍”Pythonではじめる機械学習”の2.3.3.5、Logistic回帰でforgeデータの決定境界をトレースしてみたとき、収束計算のソルバーの違いや、元データと書籍のデータの違いなどから再現性に悩んだので記録しておく。
決定境界
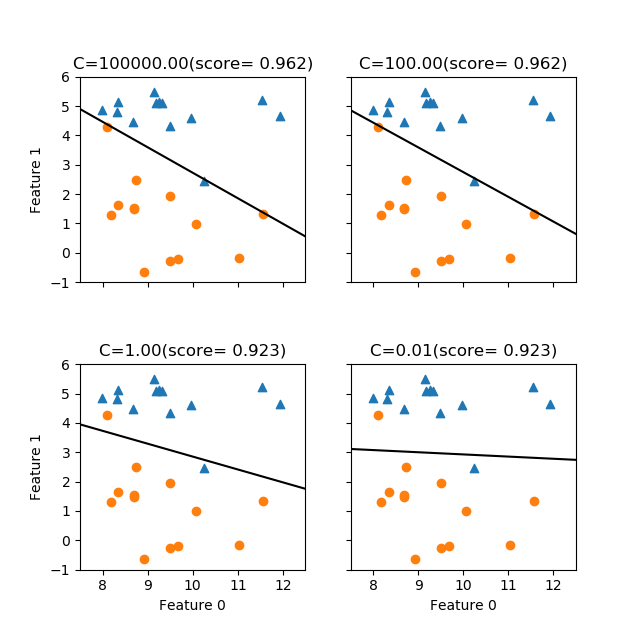
mglearnのforgeデータセットに対してLogisticRegressionを適用してみる。
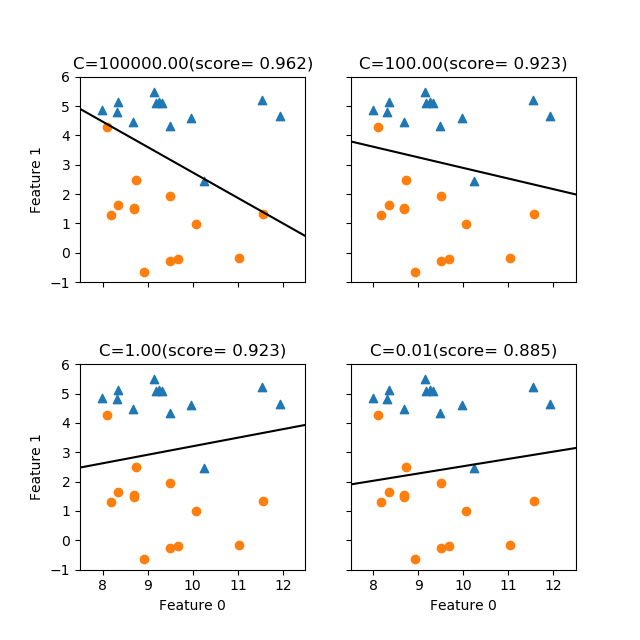
Cがかなり大きい場合、すなわち正則をほとんど行わない場合には、与えられたデータに対して可能な限り適合させようとしており、データに対する適合度は高い。Cが小さくなると正則化が効いてきて、データ全体に対して適合させようとしているように見える。

ここで上の図のC=1のケースは、書籍の図2-15右側と比べると決定境界の勾配が逆になっている。その理由は次のようであることが分かった。
- 書籍では
LogisticRegression()の収束手法を指定せず、デフォルトのsolver='liblinear'が使用されている - 今回指定なしで実行したところ、以下のような警告が発生
- FutureWarning: Default solver will be changed to ‘lbfgs’ in 0.22. Specify a solver to silence this warning.
FutureWarning) - デフォルトのソルバーが(現在はliblinearだが)ver 0.22ではlbfgsになる/このwarningを黙らせるためにソルバーを指定せよ
- FutureWarning: Default solver will be changed to ‘lbfgs’ in 0.22. Specify a solver to silence this warning.
- そこでモデルのインスタンス生成時に
LogisticRegression(solver='lbfgs')としたところ先の結果となった - 指定なし、あるいは
solver='liblinear'とすると書籍と同じ結果になる
liblinearによる結果が以下の通り。正則化の度合いに応じてlbfgsよりも傾きがダイナミックに変わっているように見える。

なお、これらの図の傾きについて、今度は書籍の図2-16と随分違っている。よく見てみると、同図のforgeデータは特に下側の〇印の点でオリジナルにはないデータがいくつか加わっているためと考えられる。
これらのコードは以下の通り。
|
1 2 3 4 5 6 7 8 9 10 11 12 13 14 15 16 17 18 19 20 21 22 23 24 25 26 27 28 29 30 31 32 33 34 35 36 37 38 39 40 41 42 |
import numpy as np import matplotlib.pyplot as plt from mglearn.datasets import make_forge from sklearn.linear_model import LogisticRegression X, y = make_forge() xmin, xmax = 7.5, 12.5 ymin, ymax = -1, 6 C_values = [1e5, 1e2, 1e0, 1e-2] fig, axs = plt.subplots(2, 2, figsize=(6.4, 6.4)) fig.subplots_adjust(hspace=0.4) axs_1d = axs.reshape(1, -1) for ax, c in zip(axs_1d[0], C_values): logreg = LogisticRegression(C=c, solver='liblinear') logreg.fit(X, y) b = logreg.intercept_[0] w0 = logreg.coef_[0][0] w1 = logreg.coef_[0][1] x_border = np.linspace(xmin, xmax) y_border = (-b - w0 * x_border) / w1 ax.scatter(X[:, 0][y==1], X[:, 1][y==1], marker='^') ax.scatter(X[:, 0][y==0], X[:, 1][y==0], marker='o') ax.plot(x_border, y_border, 'k') ax.set_xlim(xmin, xmax) ax.set_ylim(ymin, ymax) ax.set_title("C={:2.2f}(score={:6.3f})".format(c, logreg.score(X, y))) ax.set_xlabel("Feature 0") ax.set_ylabel("Feature 1") ax.label_outer() plt.show() |
3次元表示
2つのCの値について、二つの特徴量の組み合わせに対する青い点の確率分布を表示してみる(solver='lbfgs')。Cが小さいと確率分布がなだらかになる様子が見て取れるが、データに対する判別の適合度との関係はよくわからない。

|
1 2 3 4 5 6 7 8 9 10 11 12 13 14 15 16 17 18 19 20 21 22 23 24 25 26 27 28 29 30 31 32 33 34 35 36 37 38 39 40 41 42 43 44 45 46 47 48 49 50 |
import numpy as np import matplotlib.pyplot as plt from mglearn.datasets import make_forge from sklearn.linear_model import LogisticRegression from mpl_toolkits.mplot3d import Axes3D X, y = make_forge() xmin, xmax = 7.5, 12.5 ymin, ymax = -1, 6 gx = np.linspace(xmin, xmax, 40) gy = np.linspace(ymin, ymax, 40) gx, gy = np.meshgrid(gx, gy) C_values = [1e3, 1e-1] fig = plt.figure(figsize=(12, 4.8)) ax0 = fig.add_subplot(121, projection='3d') ax1 = fig.add_subplot(122, projection='3d') axs = [ax0, ax1] for ax, c in zip(axs, C_values): logreg = LogisticRegression(C=c, solver='lbfgs') logreg.fit(X, y) b = logreg.intercept_[0] w0 = logreg.coef_[0][0] w1 = logreg.coef_[0][1] gz = 1/(1 + np.exp(-b - w0*gx - w1*gy)) gz05 = np.full_like(gz, 0.5) y_border_min = (-b - w0 * xmin) / w1 y_border_max = (-b - w0 * xmax) / w1 ax.scatter(X[:, 0][y==1], X[:, 1][y==1], 0.5, color='tab:blue') ax.scatter(X[:, 0][y==0], X[:, 1][y==0], 0.5, color='tab:red') ax.plot_wireframe(gx, gy, gz, color='tab:green', alpha=0.5) ax.plot_surface(gx, gy, gz05, color='k', alpha=0.2) ax.plot([xmin, xmax], [y_border_min, y_border_max], 0.5) ax.set_xlim(xmin, xmax) ax.set_ylim(ymin, ymax) ax.set_title("C={}".format(c)) ax.set_xlabel("Feature 0") ax.set_ylabel("Feature 1") plt.show() |