文字列/記号による指定
一般に使われる4つのスタイルについては、文字列あるいは記号で指定。
"solid" |
“-“ | 連続線 |
"dashed" |
“–“ | 破線 |
"dotted" |
“:” | 点線 |
"dashdot" |
“-.” | 一点鎖線 |
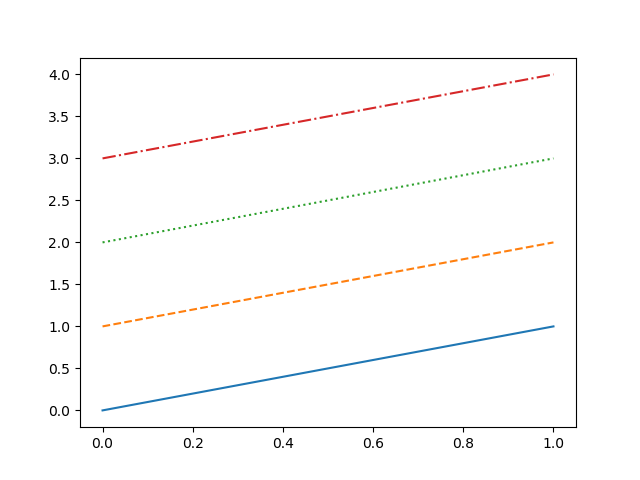
文字列指定の例
|
1 2 3 4 5 6 7 8 9 10 11 12 13 14 15 |
import numpy as np import matplotlib.pyplot as plt fig = plt.figure() ax = fig.add_subplot(111) x = np.array([0, 1]) y = np.array([0, 1]) ax.plot(x, y, linestyle="solid") ax.plot(x, y+1, linestyle="dashed") ax.plot(x, y+2, linestyle="dotted") ax.plot(x, y+3, linestyle="dashdot") plt.show() |
記号指定の例
|
1 2 3 4 |
ax.plot(x, y, linestyle="-") ax.plot(x, y+1, linestyle="--") ax.plot(x, y+2, linestyle=":") ax.plot(x, y+3, linestyle="-.") |
実行結果

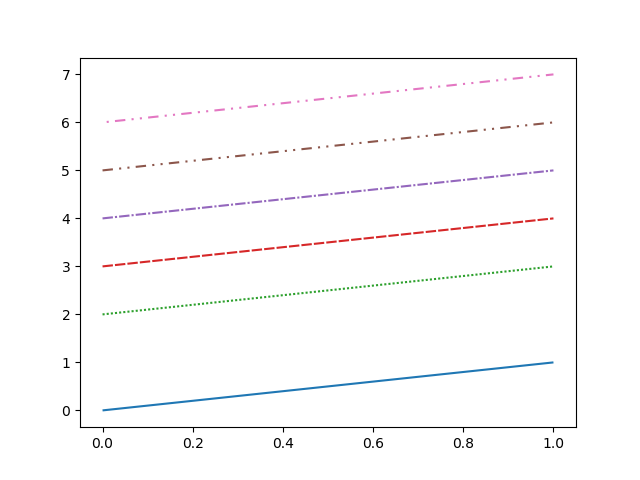
タプルによる任意のパターン指定
タプルによって、任意のパターンを設定することができる。
(offset, (fg, bg, fg, bg, ...))
第2要素のタプルの中で、前景色の長さと背景色の長さを交互に指定。第1要素は病か開始のオフセット。
|
1 2 3 4 5 6 7 |
ax.plot(x, y, linestyle=(0, (1, 0))) ax.plot(x, y+1, linestyle=(0, (0, 1))) ax.plot(x, y+2, linestyle=(0, (1, 1))) ax.plot(x, y+3, linestyle=(0, (5, 1))) ax.plot(x, y+4, linestyle=(0, (5, 1, 1, 1))) ax.plot(x, y+5, linestyle=(0, (5, 3, 1, 3, 1, 3))) ax.plot(x, y+6, linestyle=(10, (5, 3, 1, 3, 1, 3))) |
