contour~コンターライン
matplotlib.pyplot.contour()は2次元平面上のコンター(等値線)を描く。x, yの値から計算されたzの値が等しい点を曲線で結ぶ。
x, y, zの指定方法
引数がzのみの場合
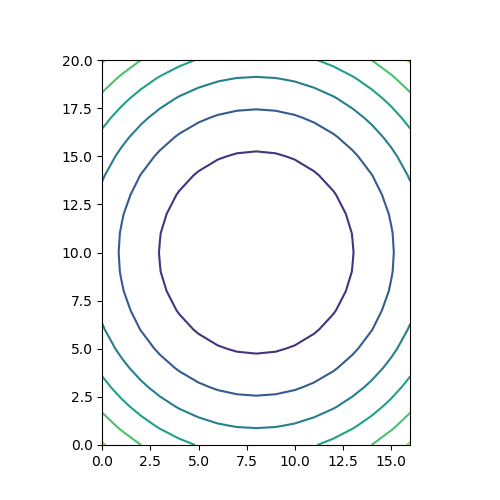
以下のコードでは、zの値のみを2次元配列で与えている。この場合は、配列zのインデックスの値が座標値となる(行番号0~20がy座標、列番号0~16がx座標)。
|
1 2 3 4 5 6 7 8 9 10 11 12 |
import numpy as np import matplotlib.pyplot as plt x = np.linspace(-1, 1, 17) y = np.linspace(-1.2, 1.2, 21) z = np.array([[u*u + v*v for u in x] for v in y]) fig = plt.figure(figsize=(5, 5)) ax = fig.add_subplot(111) ax.contour(z) ax.set_aspect('equal') plt.show() |
引数に1次元のx, yを指定
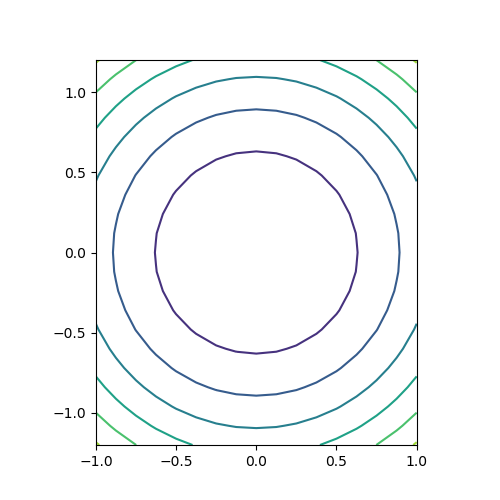
以下のコードでは、x, yを1次元配列で引数として渡している。この場合は、x, yの値が座標値として用いられる(x座標が-1~1、y座標が-1.2~1.2)。
|
1 2 3 4 5 6 7 8 9 10 11 12 |
import numpy as np import matplotlib.pyplot as plt x = np.linspace(-1, 1, 17) y = np.linspace(-1.2, 1.2, 21) z = np.array([[u*u + v*v for u in x] for v in y]) fig = plt.figure(figsize=(5, 5)) ax = fig.add_subplot(111) ax.contour(x, y, z) ax.set_aspect('equal') plt.show() |
meshgridを使う方法
最も一般的な方法。x, yの1次元配列からnumpy.meshgrid()メソッドでそれぞれの2次元配列を生成し、それらを使ってzを計算するとともに、contour()の引数に与える。結果は上と同じになる。
|
1 2 3 4 5 6 7 8 9 10 11 12 13 |
import numpy as np import matplotlib.pyplot as plt x = np.linspace(-1, 1, 17) y = np.linspace(-1.2, 1.2, 21) x, y = np.meshgrid(x, y) z = x * x + y * y fig = plt.figure(figsize=(5, 5)) ax = fig.add_subplot(111) ax.contour(x, y, z) ax.set_aspect('equal') plt.show() |
ラベル
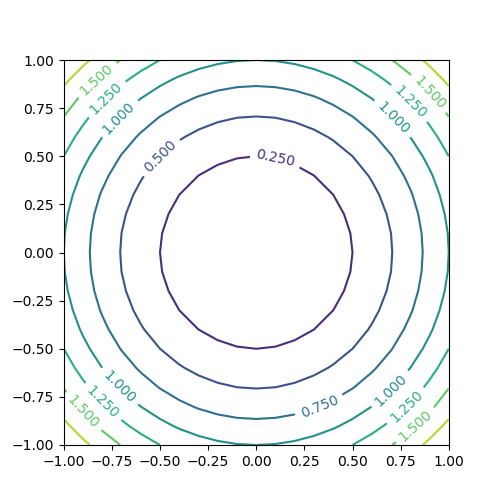
コンターの値をラベル表示させる。手順としては、contour()で描画した際の戻り値のオブジェクトを保存しておき、それをclabel()の引数として与える。
|
1 2 3 4 5 6 7 8 9 10 11 12 13 |
import numpy as np import matplotlib.pyplot as plt x = np.linspace(-1, 1, 21) y = np.linspace(-1, 1, 21) z = np.array([[u*u + v*v for u in x] for v in y]) fig = plt.figure(figsize=(5, 5)) ax = fig.add_subplot(111) cntr = ax.contour(x, y, z) ax.clabel(cntr) ax.set_aspect('equal') plt.show() |
コンターレベル
コンターの数をlevelsで指定する。数値で指定する方法と、配列等で指定する方法があるが、数値で指定する方法は条件によって期待した結果にならないことがある。
数値による指定
1つの整数値で指定する場合、ドキュメンテーションでは以下のように書かれている。
“If an int n, use n data intervals; i.e. draw n+1 contour lines. The level heights are automatically chosen.”
すなわち、n個の間隔に対してn+1本のコンターが描かれることになっている。
以下のコードを実行してみる。
|
1 2 3 4 5 6 7 8 9 10 11 12 13 14 15 16 17 18 19 20 21 22 |
import numpy as np import matplotlib.pyplot as plt x = np.linspace(-1, 1, 21) y = np.linspace(-1, 1, 21) x, y = np.meshgrid(x, y) z1 = x + y z2 = x + y + 2 fig = plt.figure(figsize=(12, 5)) ax1 = fig.add_subplot(121) cntr = ax1.contour(x, y, z1, levels=5) ax1.clabel(cntr) ax1.set_aspect('equal') ax2 = fig.add_subplot(122) cntr = ax2.contour(x, y, z2, levels=5) ax2.clabel(cntr) ax2.set_aspect('equal') plt.show() |
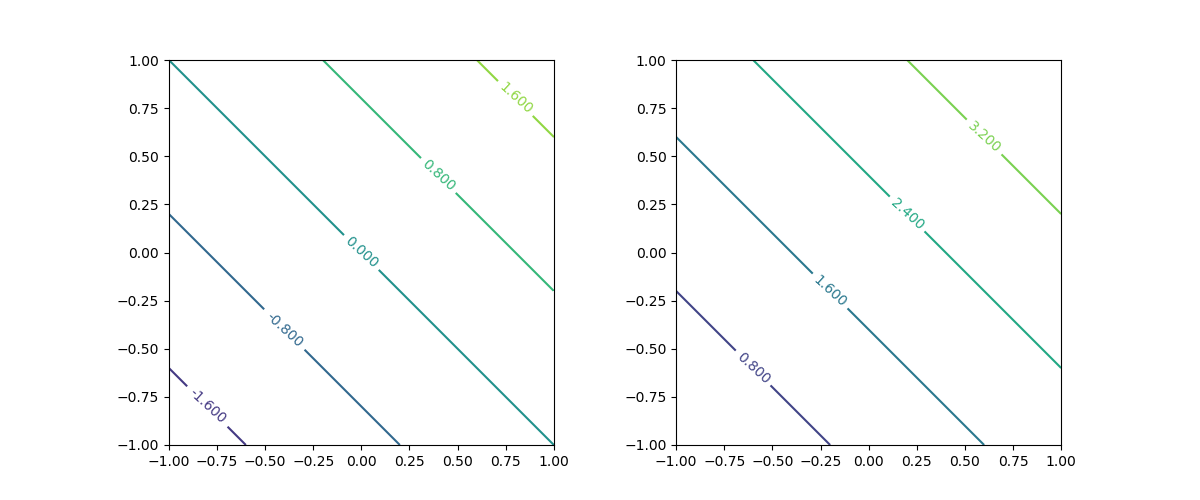
範囲と関数の関係によって、同じlevels=5を指定しているのにコンターの本数が異なる。ドキュメント通りなら、5つの間隔に対して6本のコンターが描かれるはずだが、左は6つの間隔に対して5本、右は5つの間隔に対して4本。
右の図の場合は左下でz2 = 0、右上でz2 = 4となり、コーナーの点がコンターに含まれているとすると勘定は合う。左はこれが合わないが、桁落ちなのかゼロが含まれるときに挙動が違うのか、よくわからない。
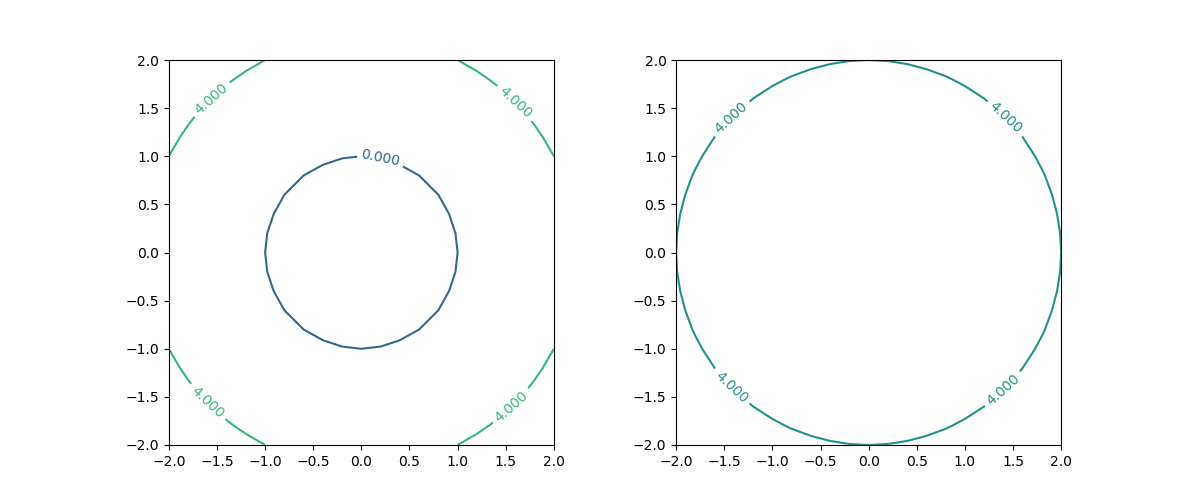
以下のようにlevels=1とした場合も、挙動が一定しない。
|
1 2 3 4 5 6 7 8 9 10 11 12 13 14 15 16 17 18 19 20 21 22 |
import numpy as np import matplotlib.pyplot as plt x = np.linspace(-2, 2, 21) y = np.linspace(-2, 2, 21) x, y = np.meshgrid(x, y) z1 = x * x + y * y - 1 z2 = x * x + y * y fig = plt.figure(figsize=(12, 5)) ax1 = fig.add_subplot(121) cntr = ax1.contour(x, y, z1, levels=1) ax1.clabel(cntr) ax1.set_aspect('equal') ax2 = fig.add_subplot(122) cntr = ax2.contour(x, y, z2, levels=1) ax2.clabel(cntr) ax2.set_aspect('equal') plt.show() |
配列等による指定
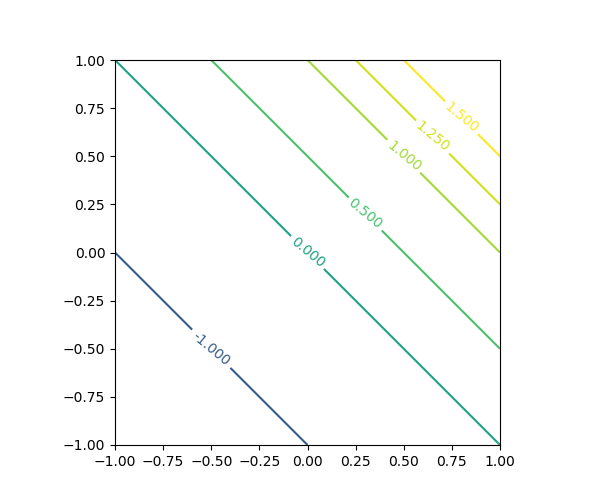
levelsをリストなどで指定すると、その要素で指定された値のコンターを描く。要素は昇順でなければならない(昇順でない場合は実行時エラー)。
|
1 2 3 4 5 6 7 8 9 10 11 12 13 14 15 16 |
import numpy as np import matplotlib.pyplot as plt x = np.linspace(-1, 1, 21) y = np.linspace(-1, 1, 21) x, y = np.meshgrid(x, y) z = x + y fig = plt.figure(figsize=(6, 5)) ax = fig.add_subplot(111) cntr = ax.contour(x, y, z, levels=[-2, -1, 0, 0.5, 1, 1.25, 1.5]) ax.clabel(cntr) ax.set_aspect('equal') plt.show() |
線のデザイン
linewidths~線の太さ
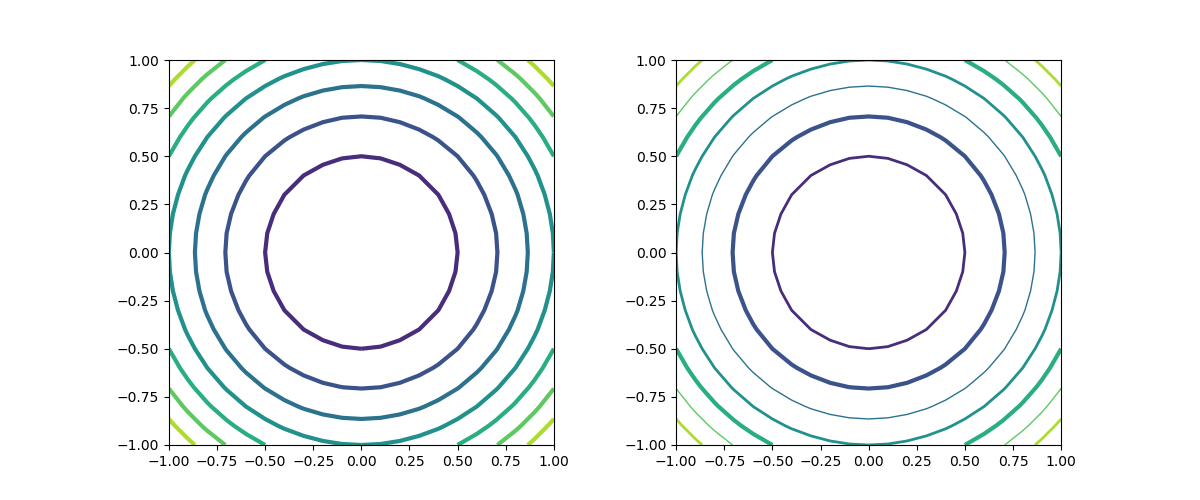
線の太さはlinewidthsで指定する。1つの数値で指定した場合は全てのコンターラインに適用、配列等で指定した場合は、サイクリックにその太さが適用される。赤字で示したように、引数名の最後に”s”が着く点に注意。
|
1 2 3 4 5 6 7 8 9 10 11 12 13 14 15 16 17 18 19 |
import numpy as np import matplotlib.pyplot as plt x = np.linspace(-1, 1, 21) y = np.linspace(-1, 1, 21) x, y = np.meshgrid(x, y) z = x * x + y * y - 1 fig = plt.figure(figsize=(12, 5)) ax1 = fig.add_subplot(121) ax1.contour(x, y, z, linewidths=3.0) ax1.set_aspect('equal') ax2 = fig.add_subplot(122) ax2.contour(x, y, z, linewidths=[1, 2, 3]) ax2.set_aspect('equal') plt.show() |
linestyles~線のスタイル
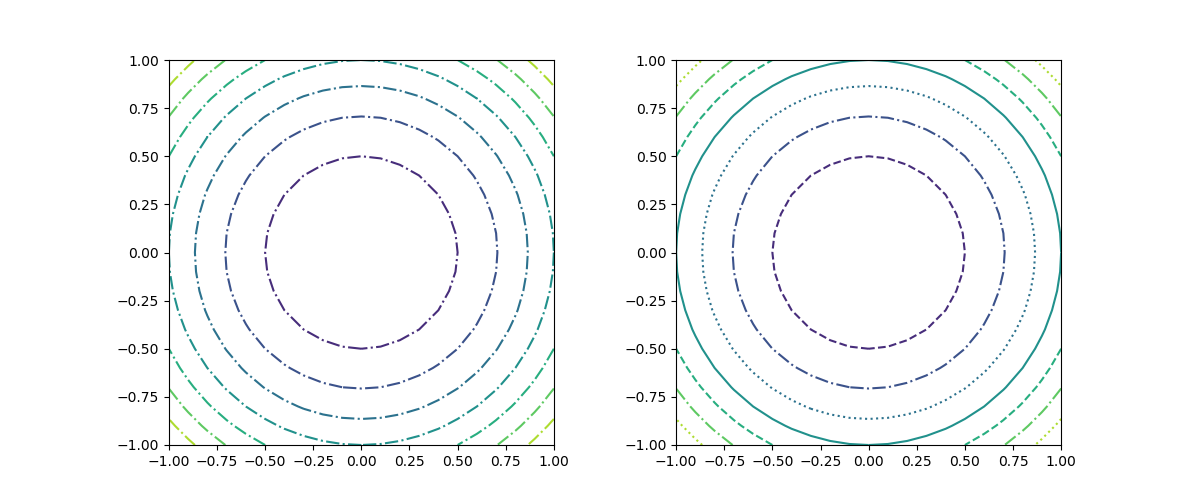
linestilesで、線のスタイルをスタイル名で指定する。複数指定した場合はサイクリックに適用される。
なお、線の色に単色を用いた場合は、負の値のコンターラインが破線('dashed')で描かれるが、この例は次のcolorsのところで示す。
|
1 2 3 4 5 6 7 8 9 10 11 12 13 14 15 16 17 18 19 |
import numpy as np import matplotlib.pyplot as plt x = np.linspace(-1, 1, 21) y = np.linspace(-1, 1, 21) x, y = np.meshgrid(x, y) z = x * x + y * y - 1 fig = plt.figure(figsize=(12, 5)) ax1 = fig.add_subplot(121) ax1.contour(x, y, z, linestyles='dashdot') ax1.set_aspect('equal') ax2 = fig.add_subplot(122) ax2.contour(x, y, z, linestyles=['solid', 'dashed', 'dashdot', 'dotted']) ax2.set_aspect('equal') plt.show() |
colors~線の色
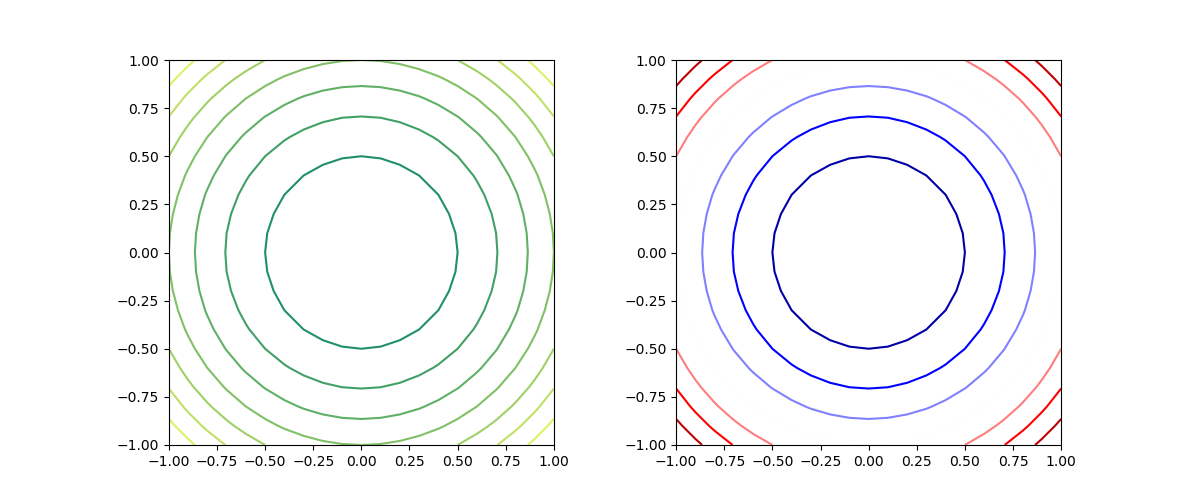
コンターラインの色はcolorsで指定する。配列等で指定するのが標準だが、単色の場合は配列化せず色名のみで指定可能。ただしその場合は、red, blue等の色名による指定方法のみ。
|
1 2 3 4 5 6 7 8 9 10 11 12 13 14 15 16 17 18 19 |
import numpy as np import matplotlib.pyplot as plt x = np.linspace(-1, 1, 21) y = np.linspace(-1, 1, 21) x, y = np.meshgrid(x, y) z = x * x + y * y - 1 fig = plt.figure(figsize=(12, 5)) ax1 = fig.add_subplot(121) ax1.contour(x, y, z, colors='blue') ax1.set_aspect('equal') ax2 = fig.add_subplot(122) ax2.contour(x, y, z, colors=['blue', 'green', 'red']) ax2.set_aspect('equal') plt.show() |
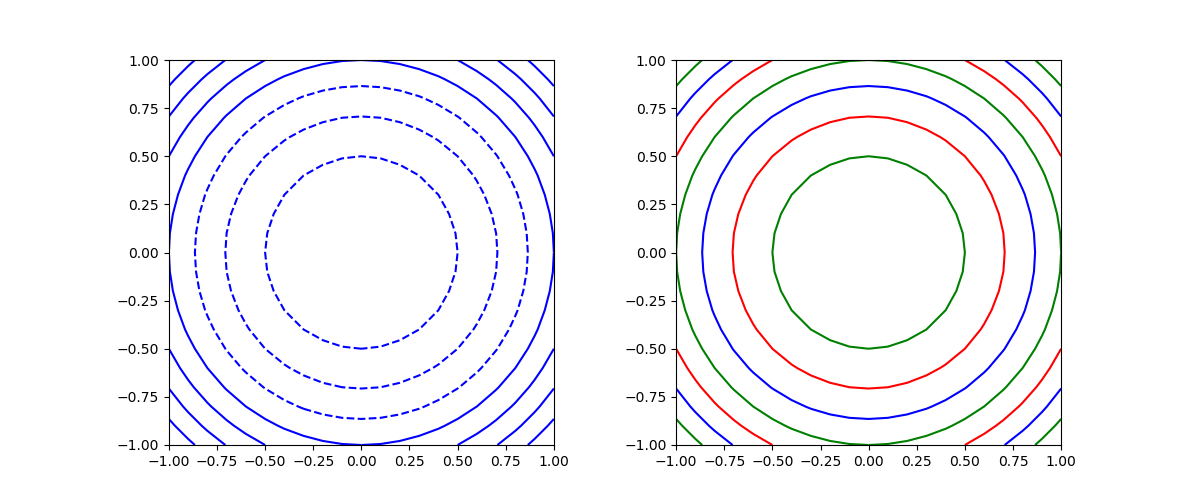
単色指定の場合、負の値に対するコンターは破線となる。
If linestyles is None, the default is ‘solid’ unless the lines are monochrome. In that case, negative contours will take their linestyle fromrcParams["contour.negative_linestyle"] = 'dashed' setting.
cmap~カラーマップ
線の色にcolormapを適用できる。
|
1 2 3 4 5 6 7 8 9 10 11 12 13 14 15 16 17 18 19 |
import numpy as np import matplotlib.pyplot as plt x = np.linspace(-1, 1, 21) y = np.linspace(-1, 1, 21) x, y = np.meshgrid(x, y) z = x * x + y * y - 1 fig = plt.figure(figsize=(12, 5)) ax1 = fig.add_subplot(121) ax1.contour(x, y, z, cmap='summer') ax1.set_aspect('equal') ax2 = fig.add_subplot(122) ax2.contour(x, y, z, cmap='seismic') ax2.set_aspect('equal') plt.show() |
alpha~透過度
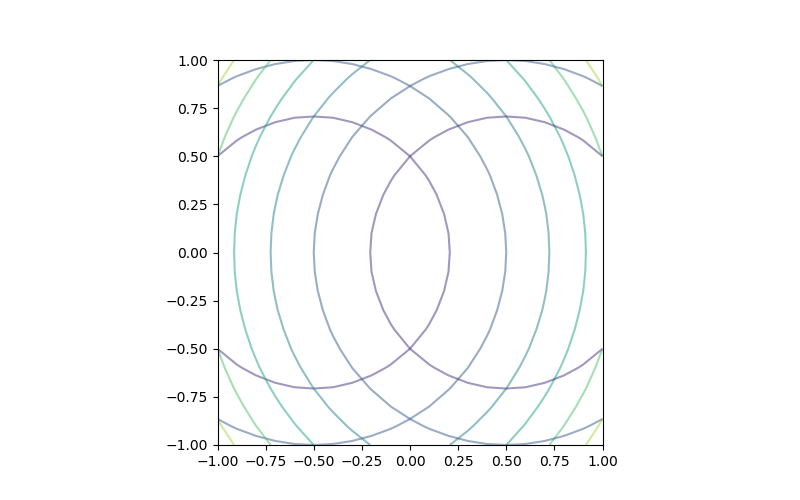
線によるコンターではあまり意味がないが、線の透過度を0 ~1の実数で指定できる。
|
1 2 3 4 5 6 7 8 9 10 11 12 13 14 15 16 17 |
import numpy as np import matplotlib.pyplot as plt x = np.linspace(-1, 1, 21) y = np.linspace(-1, 1, 21) x, y = np.meshgrid(x, y) z1 = (x + 0.5)**2 + y * y - 1 z2 = (x - 0.5)**2 + y * y - 1 fig = plt.figure(figsize=(8, 5)) ax = fig.add_subplot(111) ax.contour(x, y, z1, alpha=0.5) ax.contour(x, y, z2, alpha=0.5) ax.set_aspect('equal') plt.show() |
contourf~色付きのコンターエリア
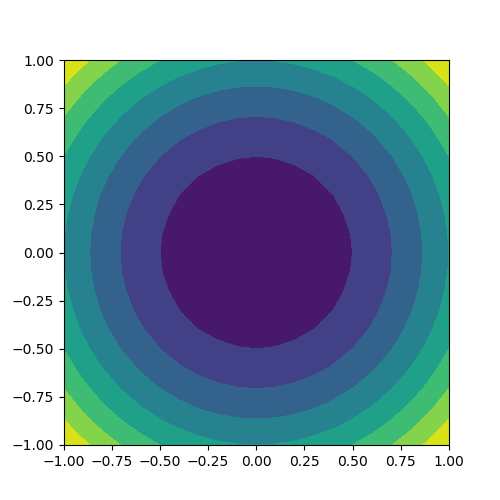
contourfはコンターラインで区切られた各エリアを色付けする。
|
1 2 3 4 5 6 7 8 9 10 11 12 13 |
import numpy as np import matplotlib.pyplot as plt x = np.linspace(-1, 1, 21) y = np.linspace(-1, 1, 21) x, y = np.meshgrid(x, y) z = x * x + y * y - 1 fig = plt.figure(figsize=(5, 5)) ax = fig.add_subplot(111) ax.contourf(x, y, z) ax.set_aspect('equal') plt.show() |
ラベル
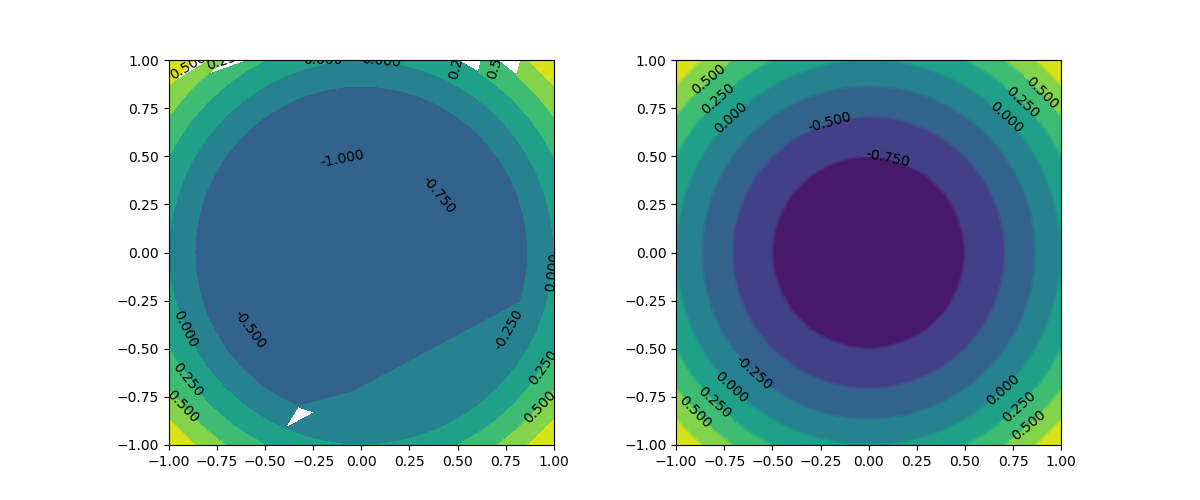
contourfでラベルを付けることはあまり想定されないが、contourと同じようにすると図が崩れてしまう。contourとcontourfの合わせ技がよい。
|
1 2 3 4 5 6 7 8 9 10 11 12 13 14 15 16 17 18 19 20 21 22 |
import numpy as np import matplotlib.pyplot as plt x = np.linspace(-1, 1, 21) y = np.linspace(-1, 1, 21) x, y = np.meshgrid(x, y) z = x * x + y * y - 1 fig = plt.figure(figsize=(12, 5)) ax1 = fig.add_subplot(121) cntr = ax1.contourf(x, y, z) ax1.clabel(cntr, colors='black') ax1.set_aspect('equal') ax2 = fig.add_subplot(122) ax2.contourf(x, y, z) cntr = ax2.contour(x, y, z) ax2.clabel(cntr, colors='black') ax2.set_aspect('equal') plt.show() |
デザイン
cmap~カラーマップ
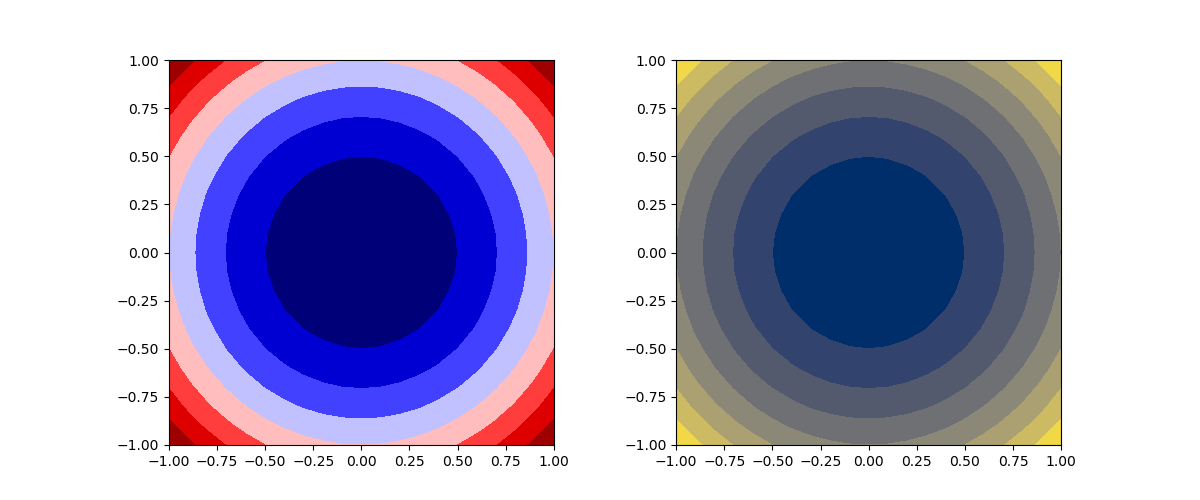
コンターエリアの色分けにカラーマップを指定できる。
|
1 2 3 4 5 6 7 8 9 10 11 12 13 14 15 16 17 18 19 |
import numpy as np import matplotlib.pyplot as plt x = np.linspace(-1, 1, 21) y = np.linspace(-1, 1, 21) x, y = np.meshgrid(x, y) z = x * x + y * y - 1 fig = plt.figure(figsize=(12, 5)) ax1 = fig.add_subplot(121) ax1.contourf(x, y, z, cmap='seismic') ax1.set_aspect('equal') ax2 = fig.add_subplot(122) ax2.contourf(x, y, z, cmap='cividis') ax2.set_aspect('equal') plt.show() |
alpha~透過度
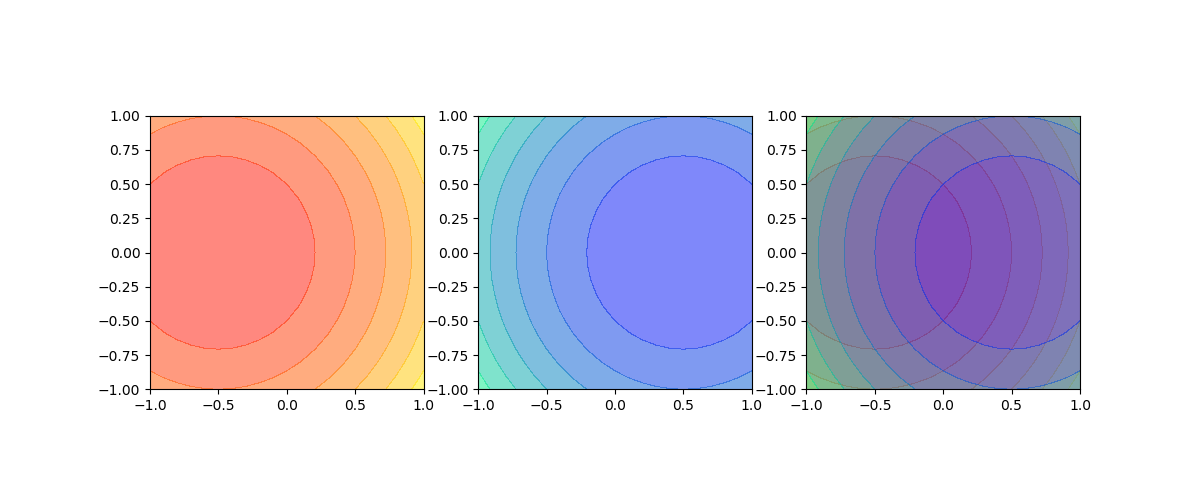
透過度を1未満に設定して、透過させることができる。
|
1 2 3 4 5 6 7 8 9 10 11 12 13 14 15 16 17 18 19 20 21 22 23 24 25 |
import numpy as np import matplotlib.pyplot as plt x = np.linspace(-1, 1, 21) y = np.linspace(-1, 1, 21) x, y = np.meshgrid(x, y) z1 = (x + 0.5)**2 + y * y - 1 z2 = (x - 0.5)**2 + y * y - 1 fig = plt.figure(figsize=(12, 5)) ax1 = fig.add_subplot(131) ax1.contourf(x, y, z1, cmap='autumn', alpha=0.5) ax1.set_aspect('equal') ax2 = fig.add_subplot(132) ax2.contourf(x, y, z2, cmap='winter', alpha=0.5) ax2.set_aspect('equal') ax3 = fig.add_subplot(133) ax3.contourf(x, y, z1, cmap='autumn', alpha=0.5) ax3.contourf(x, y, z2, cmap='winter', alpha=0.5) ax3.set_aspect('equal') plt.show() |
