概要
pyplot.figure()は、実行のたびに新たなfigureオブジェクトを生成する。コンソールからの実行環境下では、各figureオブジェクトは別々のウィンドウとして表示され、それぞれにファイルへの保存が可能。
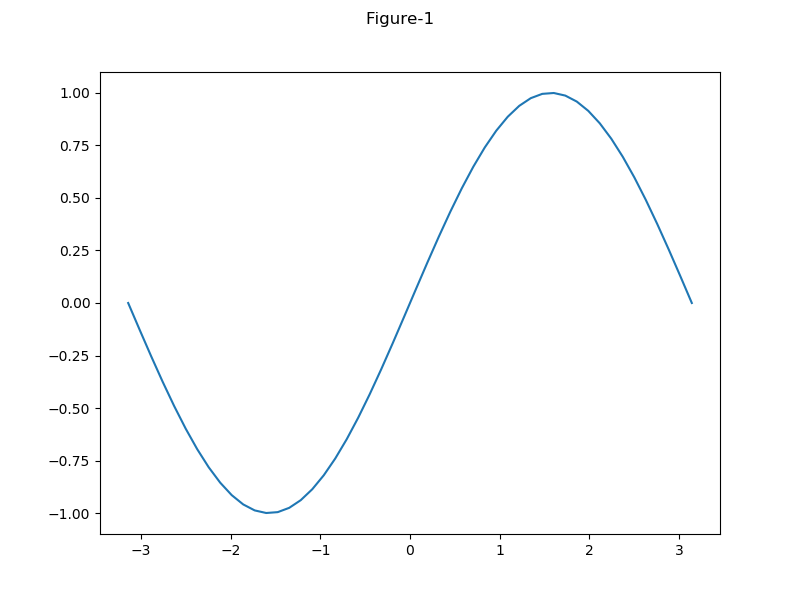
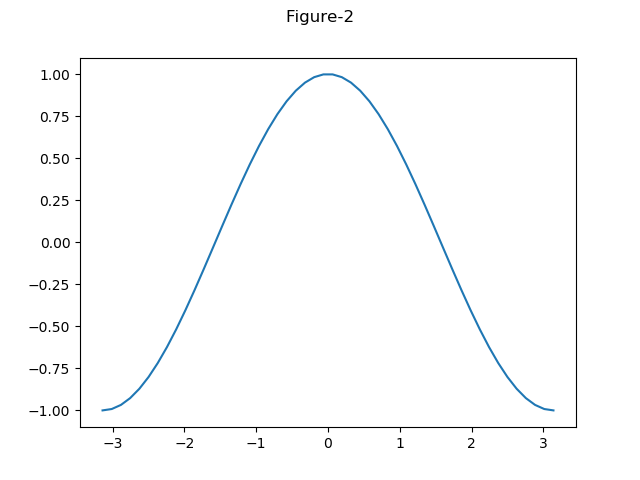
以下の例では、2つのfigureオブジェクトを生成し、それぞれにグラフをプロットし、それらをファイルに保存している。
figureで生成される図のサイズはfigsize=(width, height)で指定し、width, heightはインチ単位で指定する。省略した場合のデフォルトサイズは、6.4in×4.8in。
なお、figureオブジェクトを生成してグラフを描画する場合、直接figureに対してではなく、その中にaxesオブジェクトを追加して操作するのが通常。
|
1 2 3 4 5 6 7 8 9 10 11 12 13 14 15 16 17 18 19 |
import numpy as np import matplotlib.pyplot as plt x = np.linspace(-np.pi, np.pi) y1 = np.sin(x) y2 = np.cos(x) fig1 = plt.figure(figsize=(8, 6)) fig1.suptitle("Figure-1") plt.plot(x, y1) fig2 = plt.figure() fig2.suptitle("Figure-2") plt.plot(x, y2) fig1.savefig("matplotlib_pyplot_fig_1.png") fig2.savefig("matplotlib_pyplot_fig_2.png") plt.show() |
matplotlib_pyplot_fig_1.png

matplotlib_pyplot_fig_2
