概要
1つのfigureの中に複数のaxesを表示する方法には、add_subplot()メソッド、subplots()メソッドの2通りがある。
add_subplot()による方法
Figure.add_subplot()は既存のfigureオブジェクトにsubplotを追加してAxesオブジェクトを生成する。
add_subplot()- figureに1つのAxesオブジェクトを生成
add_subplot(pos)posは行数・列数・位置を表す3桁の整数。例えば234なら、2行3列のうち4番目の図。各数は当然10未満でなければならない。add_subplot(nrows, ncols, index)- 上記の
posを分解して指定。行数・列数が多いときに使える。
|
1 2 3 4 5 6 7 8 9 10 11 12 13 14 15 16 17 18 19 20 21 22 23 24 25 26 |
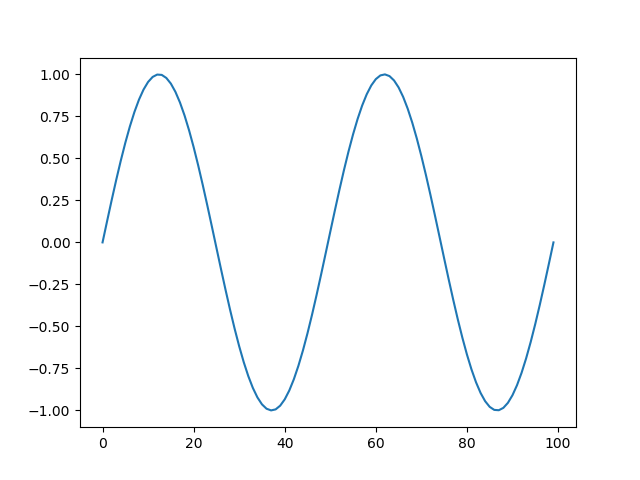
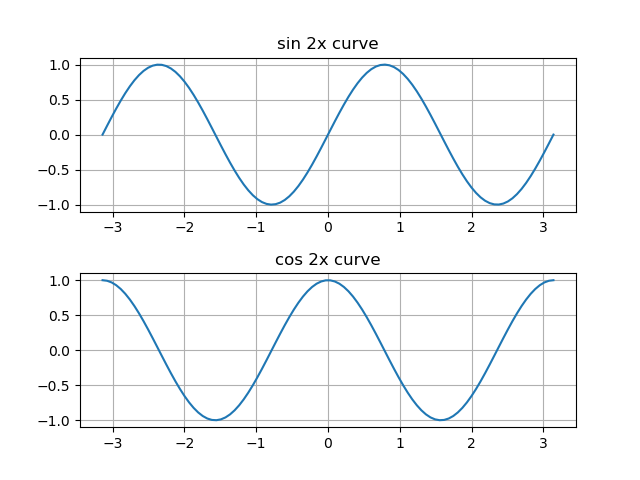
import numpy as np import matplotlib.pyplot as plt x = np.linspace(-np.pi, np.pi, num=100, endpoint=True) y1 = np.sin(x*2) y2 = np.cos(x*2) fig1 = plt.figure() ax1 = fig1.add_subplot() ax1.plot(y1) fig2 = plt.figure() fig2.subplots_adjust(hspace = 0.4) ax2 = fig2.add_subplot(211) ax3 = fig2.add_subplot(2, 1, 2) ax2.set_title("sin 2x curve") ax2.grid(True) ax2.plot(x, y1) ax3.set_title("cos 2x curve") ax3.grid(True) ax3.plot(x, y2) plt.show() |
subplots()による方法
Figure.subplots()は行数と列数を指定して各位置のaxesを配列として一度に生成する。
subplots(nrows=1, ncols=1, figsize=(6.4, 4.8))nrows、ncolsはsubplotの行数・列数。
戻り値はaxesの配列だが、行数・列数によって配列の次元が違ってくるので注意。
| 行数・列数とも1の場合(あるいはnrows、ncolsを省略した場合) | Axesオブジェクトが1つ生成される。 |
| 行数・列数のいずれかが1の場合 | 1次元のAxesオブジェクトの配列が生成される。 |
| 行数・列数とも1より大きい場合 | nrows×ncolsのサイズで2次元のAxesオブジェクトの配列が生成される。 |
|
1 2 3 4 5 6 7 8 9 10 11 12 13 14 15 16 17 18 19 20 21 22 |
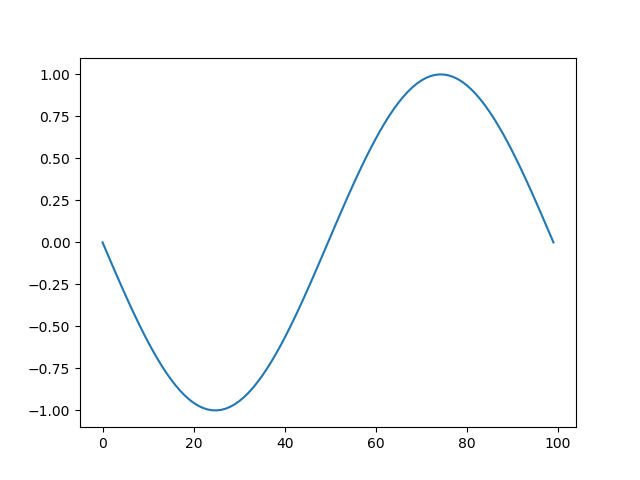
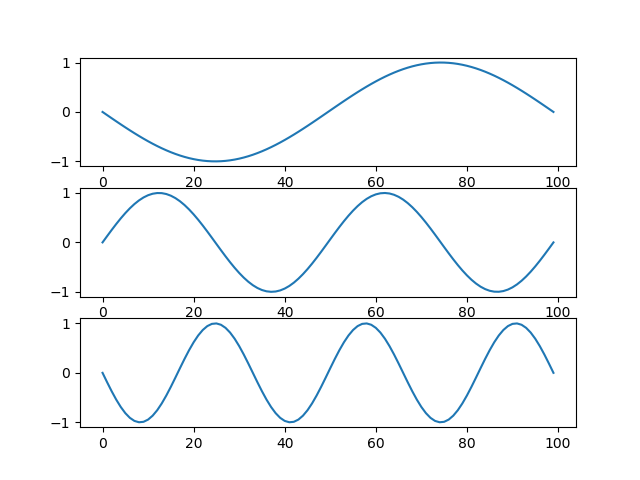
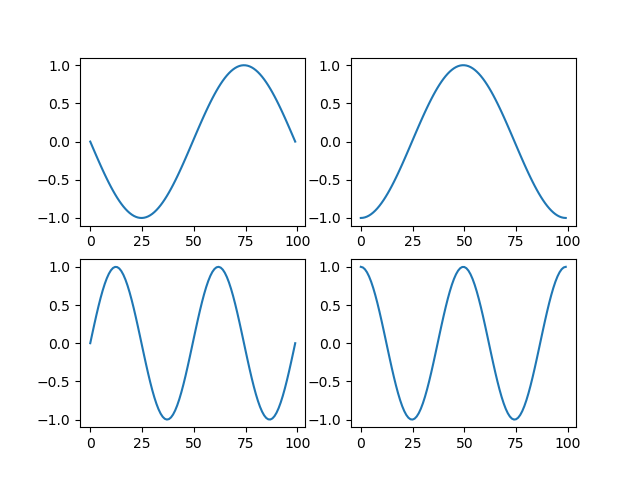
import numpy as np import matplotlib.pyplot as plt x = np.linspace(-np.pi, np.pi, num=100, endpoint=True) fig1, ax1 = plt.subplots() ax1 = ax1.plot(np.sin(x)) fig2, ax2 = plt.subplots(3, 1) for n in range(3): ax2[n].plot(np.sin(x * (n + 1))) fig3, ax3 = plt.subplots(2, 2, figsize=(6.4, 4.8)) ax3[0, 0].plot(np.sin(x)) ax3[0, 1].plot(np.cos(x)) ax3[1, 0].plot(np.sin(x * 2)) ax3[1, 1].plot(np.cos(x * 2)) plt.show() |
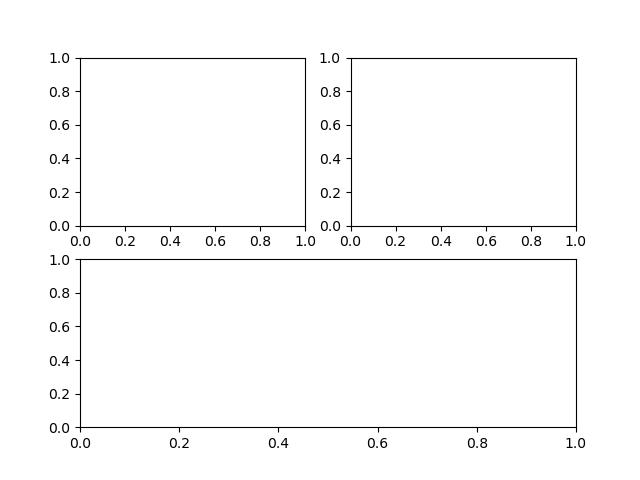
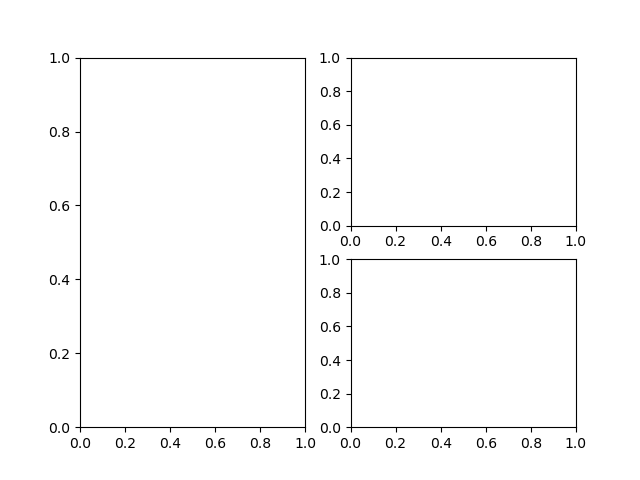
行や列のぶち抜きグラフを描きたいとき
以下のようなグラフを描きたいときの方法はこちら。
subplotの間隔や位置調整
figure内にsubplotで配置されたグラフの間隔やマージンを調整するにはsubplots_adjust()メソッドを用いる。
詳細な使い方はこちらを参照。