概要
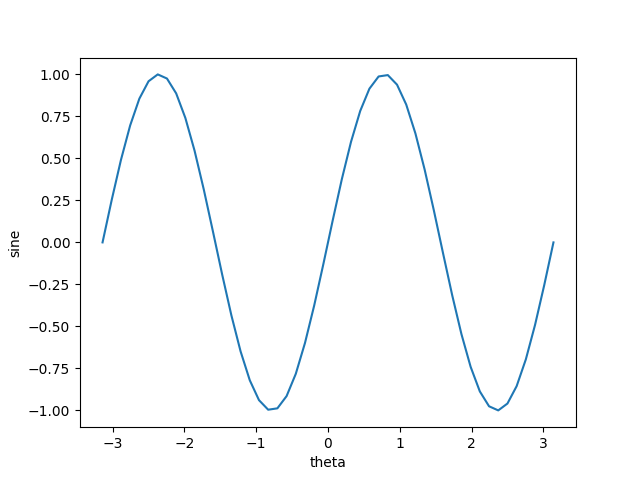
Axesに描いたグラフの軸にラベルを付けるには、set_xlabel()やset_ylabel()を使う。
|
1 2 3 4 5 6 7 8 9 10 11 12 |
import numpy as np import matplotlib.pyplot as plt x = np.linspace(-np.pi, np.pi) y = np.sin(x * 2) fig = plt.figure() ax = fig.add_subplot() ax.plot(x, y) ax.set_xlabel("theta") ax.set_ylabel("sine") plt.show() |

位置等の調整
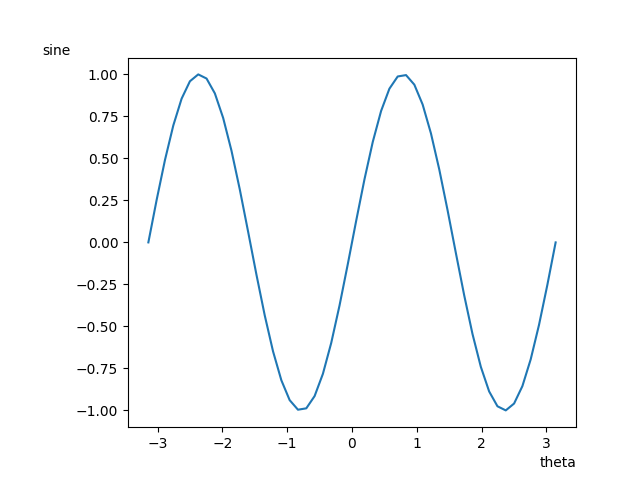
ラベルの位置はlocパラメーターで調整する。x軸とy軸では設定値が異なる(matplotlibのバージョンが3.1.1ではエラーになるので、3.3.1にアップグレード)。
set_xlabel("labelname", loc='left'/'center'/'right')
set_ylabel("labelname", loc='bottom'/'center'/'top')
以下の例では、set_ylabel()のパラメーターにTextのプロパティーとしてrotationを指定している(そのままだと横にしたラベルがエリア外に切れてしまうので、8行目でsubplots_adjustを指定している)。
|
1 2 3 4 5 6 7 8 9 10 11 12 |
import numpy as np import matplotlib.pyplot as plt x = np.linspace(-np.pi, np.pi) y = np.sin(x * 2) fig, ax = plt.subplots() fig.subplots_adjust(left=0.2) ax.plot(x, y) ax.set_xlabel("theta", loc='right') ax.set_ylabel("sine", loc='top', rotation='horizontal') plt.show() |
