概要
Pythonのライブラリーを使った3次元グラフ表示の概要をまとめる。大きな流れは以下の通り。
|
1 2 3 4 5 6 7 8 9 10 11 12 13 |
# ライブラリーの読み込み import numpy as np import matplotlib.pyplot as plt from mpl_toolkits.mplot3d import Axes3D # Axes3Dオブジェクトの生成 fig = plt.figure() ax = fig.add_subplot(111, projection='3d') # 各種描画処理 # プロットの表示 plt.show() |
Axes3Dオブジェクトの生成で以下のようにしている例もあるが、古いバージョンのものであり、matplotlibのチュートリアルでは上記の方法を推奨している。
|
1 2 |
fig = plt.figure() ax = Axes3D(fig) |
なお、FigureオブジェクトとAxes3Dオブジェクトを1行で生成する方法がこちらに紹介されている。この方法だと1行ですみ、複数のAxes3Dを一度に生成できる。
|
1 |
fig, ax = plt.subplots(subplot_kw=dict(projection='3d')) |
各種描画処理
scatter~点の表示
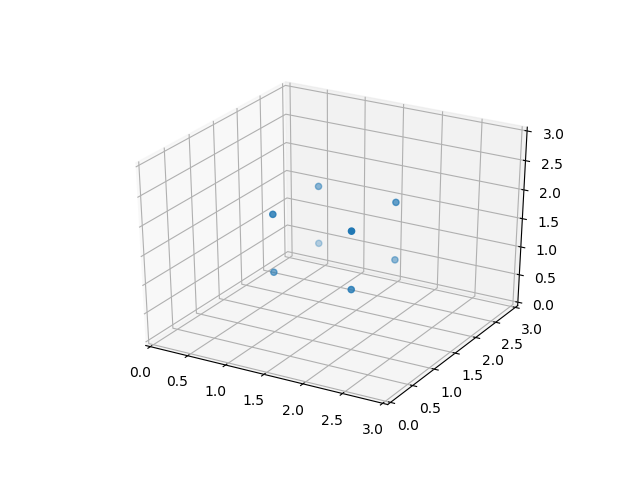
2次元のscatterと同じで、x, y, zの3次元の座標を配列で指定。以下の例では立方体の8つの頂点を3次元空間内に表示する。
|
1 2 3 4 5 6 7 8 9 10 11 12 13 14 15 |
import numpy as np import matplotlib.pyplot as plt from mpl_toolkits.mplot3d import Axes3D x = [1, 1, 2, 2, 1, 1, 2, 2] y = [1, 2, 1, 2, 1, 2, 1, 2] z = [1, 1, 1, 1, 2, 2, 2, 2] fig = plt.figure() ax = fig.add_subplot(111, projection="3d") ax.set_xlim3d(0, 3) ax.set_ylim3d(0, 3) ax.set_zlim3d(0, 3) ax.scatter(x, y, z) plt.show() |

このコードの概要は以下の通り。
- 8つの頂点の座標の準備
- x, y, zの座標ごとに配列で準備
figureオブジェクトの取得- axesオブジェクトの取得
- axesオブジェクトの取得
- 3次元とするために
fig.add_subplot(111, projection="3d")としている
- x,y,z軸の範囲を設定
- 3次元用のメソッド
axes.set_xlim3d(min, max)などで指定
- 3次元用のメソッド
- 点の表示
axes.scatter(x, y, z)と3次元座標で指定
なお、上記の表示結果はマウスでドラッグして回転することができる。
plot~曲線の表示
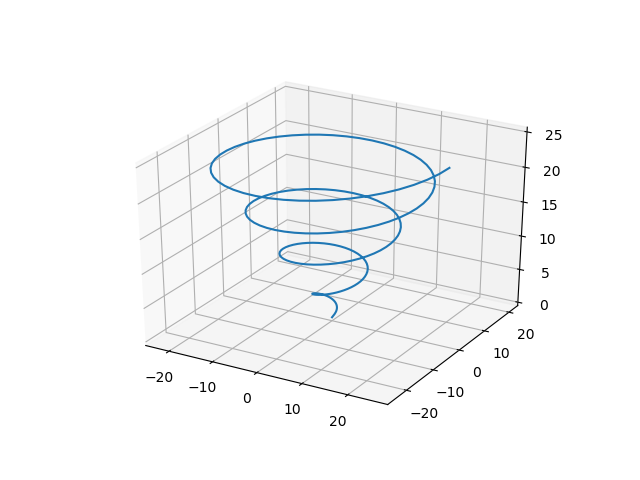
Axes3D.plot(x, y, z)によって、3次元空間内に曲線を描く。
以下の例は、パラメータ表示された以下の曲線を描いている。
(1) ![]()
|
1 2 3 4 5 6 7 8 9 10 11 12 13 14 15 |
import numpy as np import matplotlib.pyplot as plt from mpl_toolkits.mplot3d import Axes3D t = np.linspace(0, 8 * np.pi, num=200) x = t * np.cos(t) y = t * np.sin(t) z = t fig = plt.figure() ax = fig.add_subplot(111, projection='3d') ax.plot(x, y, z) plt.show() |

plot_wireframe/plot_sufrace~曲面の表示
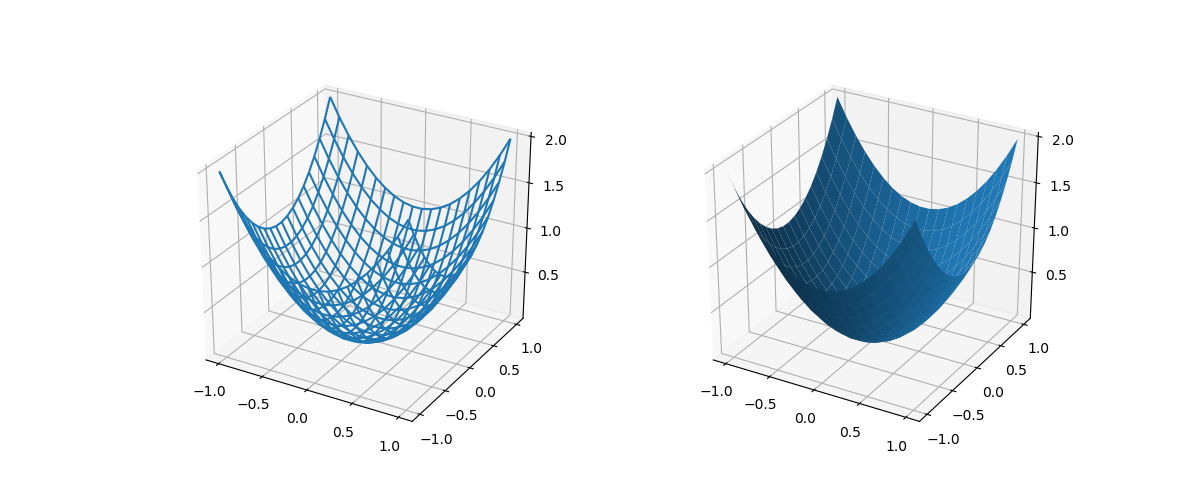
meshgrideで生成した座標面に対するf(x, y)の位置を使って、3次元の曲面を描く。plot_wireframeはワイヤーフレーム、plot_surfaceはワイヤーフレームの中の面が塗りつぶされる。以下の例では、z = x2 + y2の関数の形状を、ワイヤーフレームと曲面で描く。
|
1 2 3 4 5 6 7 8 9 10 11 12 13 14 15 16 17 18 19 20 21 22 23 24 25 26 27 |
import numpy as np import matplotlib.pyplot as plt from mpl_toolkits.mplot3d import Axes3D x = np.linspace(-1, 1, 20) y = np.linspace(-1, 1, 20) x, y = np.meshgrid(x, y) z = x**2 + y**2 h_ticks = np.linspace(-1, 1, 5) v_ticks = np.linspace(0, 2, 5) fig = plt.figure(figsize=(12, 5)) ax1 = fig.add_subplot(121, projection="3d") ax1.set_xticks(h_ticks) ax1.set_yticks(h_ticks) ax1.set_zticks(v_ticks) ax1.plot_wireframe(x, y, z) ax2 = fig.add_subplot(122, projection="3d") ax2.set_xticks(h_ticks) ax2.set_yticks(h_ticks) ax2.set_zticks(v_ticks) ax2.plot_surface(x, y, z) plt.show() |

このコードの概要は以下の通り。
- 表示させる放物面の準備
x,yの軸座標を生成numpy.meshgrid()関数で全格子点の座標を生成- 格子点座標に対する
zの値を計算
x,y軸の軸目盛をhticks、z軸の軸目盛をvticksとして準備figureの生成axesの1つ目を生成し、ワイヤーフレーム表示x,y,z軸の軸目盛をaxes.set_xticks()などのメソッドで設定- ワイヤーフレームの描画
ax1.plot_wireframe(x, y, z)
axesの2つ目を生成し、曲面表示x,y,z軸の軸目盛をaxes.set_xticks()などのメソッドで設定- 曲面の描画
ax1.plot_surface(x, y, z)
コンターの表示
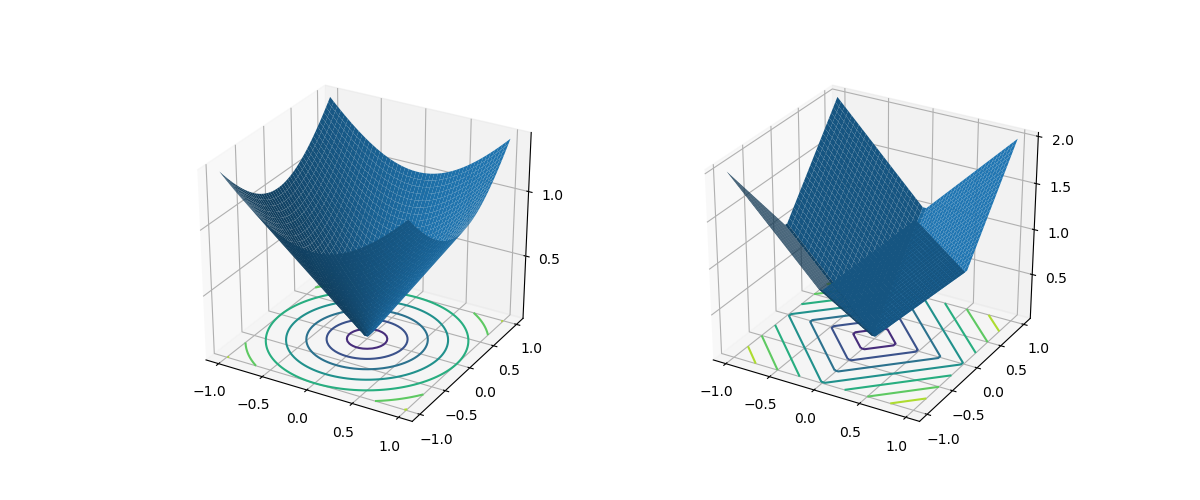
指定したz座標の位置に、f(x, y)のコンターを描く。以下の例では、z = x2 + y2の関数の曲面を描き、z=0の面にコンターを描く。
|
1 2 3 4 5 6 7 8 9 10 11 12 13 14 15 16 17 18 19 20 21 22 23 24 25 26 27 28 29 30 |
import numpy as np import matplotlib.pyplot as plt from mpl_toolkits.mplot3d import Axes3D x = np.linspace(-1, 1, 50) y = np.linspace(-1, 1, 50) x, y = np.meshgrid(x, y) z3 = np.sqrt(x**2 + y**2) z4 = np.abs(x) + np.abs(y) h_ticks = np.linspace(-1, 1, 5) v_ticks = np.linspace(0, 2, 5) fig = plt.figure(figsize=(12, 5)) ax3 = fig.add_subplot(121, projection="3d") ax3.set_xticks(h_ticks) ax3.set_yticks(h_ticks) ax3.set_zticks(v_ticks) ax3.plot_surface(x, y, z3) ax3.contour(x, y, z3, offset=0) ax4 = fig.add_subplot(122, projection="3d") ax4.set_xticks(h_ticks) ax4.set_yticks(h_ticks) ax4.set_zticks(v_ticks) ax4.plot_surface(x, y, z4) ax4.contour(x, y, z4, offset=0) plt.show() |

このコードの手順は上の曲面の表示とほぼ同じで、上記と異なる点は以下の通り。
- 2つの関数のコンターを比べるのに、xy平面上の点の原点からのL2ノルムとL1ノルムを使っている。
axes.contour()関数でコンターを描画している。contour(x, y, z, offset)のoffsetは、コンターを表示する平面のzの値で指定