概要
sklearn.preprocessorsモジュールのNormalizerは、特徴量ベクトルのノルムが1になるようにする。具体的には、データごとに特徴量Fiを以下の式によってFi*に変換する。
(1) ![]()
ノルムのタイプはコンストラクターの引数で指定する。デフォルトは'l2'で、その他に'l1'、'max'を指定可能。
Normalizer(norm='l2')
挙動
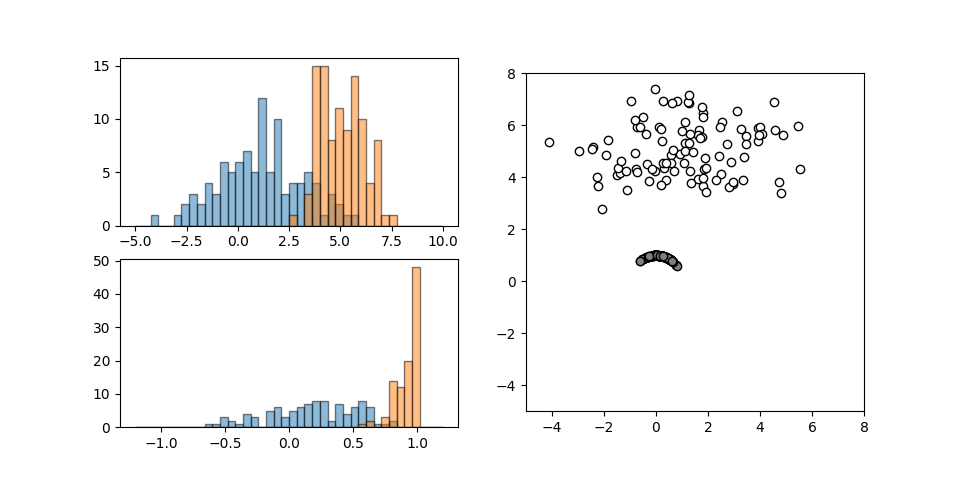
それぞれ異なる正規分布に従う2つの特徴量について、Normalizerを適用したときの挙動を以下に示す。
scalerのような相似性の変換ではないので左下の変換後のヒストグラムは変換前の形状と異なっている。
データの空間的な分布は、デフォルトのL2ノルムの指定によって全データが半径1の円周上に位置するよう変換される。

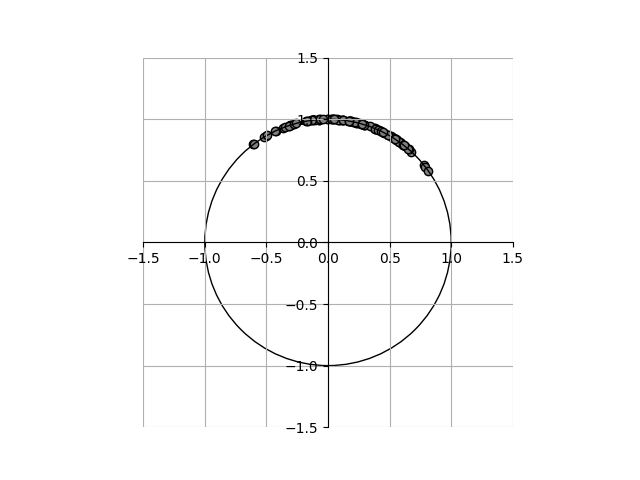
変換後のデータを拡大してみると以下の通りで、原点を中心とした半径1の円周上に各点が並んでいる。

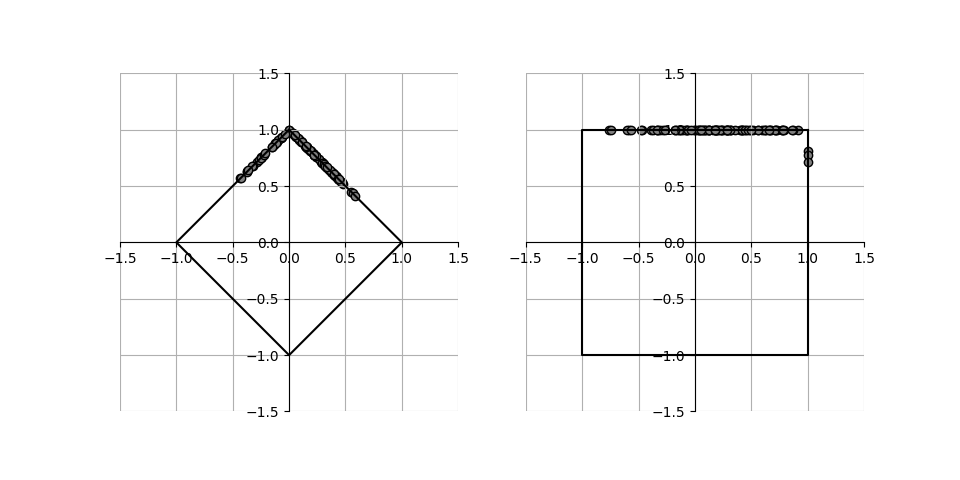
他の2つ、L1ノルムと最大値ノルムを指定して実行した結果が下記の通りで、それぞれのノルムに応じた線上に各点が並んでいる。

コードは以下の通りで、データに対してfit()メソッドでスケールパラメーターを決定し、transform()メソッドで変換を行うところを、これらを連続して実行するfit_transform()メソッドを使っている。
|
1 2 3 4 5 6 7 8 9 10 11 12 13 14 15 16 17 18 19 20 21 22 23 24 25 26 27 28 29 30 31 32 33 34 35 36 37 38 39 40 41 42 43 44 45 46 47 48 49 50 51 52 53 54 55 56 57 58 59 60 61 62 63 64 65 66 |
import numpy as np import numpy.random as rnd import matplotlib.pyplot as plt import matplotlib.patches as patch from sklearn.preprocessing import Normalizer rnd.seed(0) x1 = rnd.normal(loc=1, scale=2, size=100) x2 = rnd.normal(loc=5, scale=1, size=100) X = np.hstack((x1.reshape(-1, 1), x2.reshape(-1, 1))) X_trans = Normalizer().fit_transform(X) fig1 = plt.figure(figsize=(9.6, 4.8)) ax1 = fig1.add_subplot(2, 2, 1) ax2 = fig1.add_subplot(2, 2, 3) ax3 = fig1.add_subplot(1, 2, 2) ax1.hist(X[:, 0], ec='k', range=(-5, 10), bins=40, alpha=0.5) ax1.hist(X[:, 1], ec='k', range=(-5, 10), bins=40, alpha=0.5) ax2.hist(X_trans[:, 0], range=(-1.2, 1.2), bins=40, ec='k', alpha=0.5) ax2.hist(X_trans[:, 1], range=(-1.2, 1.2), bins=40, ec='k', alpha=0.5) ax3.scatter(X[:, 0], X[:, 1], ec='k', fc='w') ax3.scatter(X_trans[:, 0], X_trans[:, 1], ec='k', fc='gray') ax3.set_aspect('equal') ax3.set_xlim(-5, 8) ax3.set_ylim(-5, 8) fig2, ax4 = plt.subplots() ax4.scatter(X_trans[:, 0], X_trans[:, 1], ec='k', fc='gray') ax4.set_aspect('equal') ax4.set_xlim(-1.5, 1.5) ax4.set_ylim(-1.5, 1.5) ax4.grid() ax4.spines['top'].set_visible(False) ax4.spines['right'].set_visible(False) ax4.spines['bottom'].set_position('zero') ax4.spines['left'].set_position('zero') circ = patch.Circle(xy=(0, 0), radius=1, ec='k', fill=False) ax4.add_patch(circ) X_trans_l1 = Normalizer('l1').fit_transform(X) X_trans_max = Normalizer('max').fit_transform(X) fig3, axes = plt.subplots(1, 2, figsize=(9.6, 4.8)) axes[0].scatter(X_trans_l1[:, 0],X_trans_l1[:, 1], ec='k', fc='gray') axes[0].plot([0, 1, 0, -1, 0], [1, 0, -1, 0, 1], c='k') axes[1].scatter(X_trans_max[:, 0],X_trans_max[:, 1], ec='k', fc='gray') axes[1].plot([1, 1, -1, -1, 1], [1, -1, -1, 1, 1], c='k') for ax in axes.reshape(-1): ax.set_aspect('equal') ax.set_xlim(-1.5, 1.5) ax.set_ylim(-1.5, 1.5) ax.grid() ax.spines['top'].set_visible(False) ax.spines['right'].set_visible(False) ax.spines['bottom'].set_position('zero') ax.spines['left'].set_position('zero') plt.show() |
特徴
Normalizerは特徴量ベクトルの方向だけが重要な場合に用いる。たとえば空間内の特定の方向範囲にあるクラスターの分離などかと思うが、抽象的なものになると想像がつかない。実際、サイト上で見ても、Normalizerの意義とデータの性質に基づいて適用しているケースは、検索上位には出てこない。
なおNormalizerによる変換は不可逆であり、scalerのようなinverse_transform()を持たない。