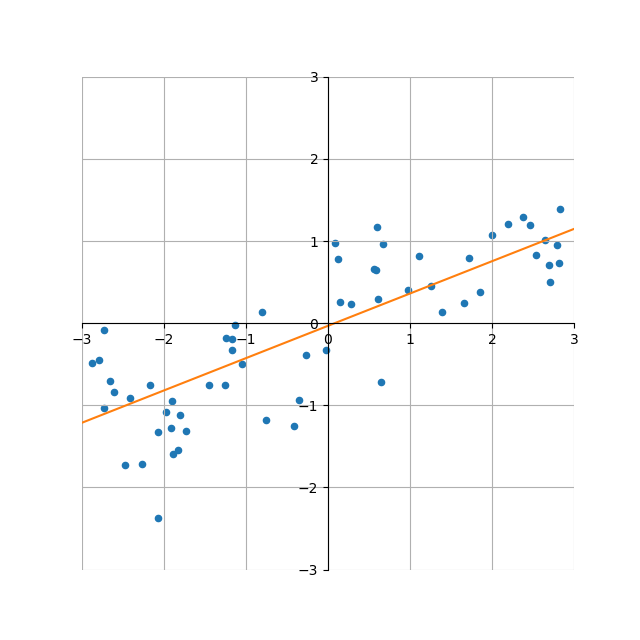
O’Reillyの”Pythonではじめる機械学習”に載っている、scikit-learnの線形回帰のwaveデータセットへの適用の再現。
waveデータセットのサンプル数を60、train_test_split()でrandom_satet=42として、書籍と同じグラフを得る。

|
1 2 3 4 5 6 7 8 9 10 11 12 13 14 15 16 17 18 19 20 21 22 23 24 25 26 27 28 29 30 31 32 33 34 35 36 37 |
import numpy as np import matplotlib.pyplot as plt from sklearn.model_selection import train_test_split from sklearn.linear_model import LinearRegression from mglearn.datasets import make_wave xmin, xmax = -3, 3 ymin, ymax = -3, 3 X_source, y_source = make_wave(n_samples=60) X_train, X_test, y_train, y_test = train_test_split(X_source, y_source, random_state=42) linreg = LinearRegression() linreg.fit(X_train, y_train) X_test = np.linspace(xmin, xmax, 2).reshape(-1, 1) y_test = linreg.predict(X_test) print(linreg.coef_[0], linreg.intercept_) fig, ax = plt.subplots(figsize=(6.4, 6.4)) ax.scatter(X_source, y_source, s=20) ax.plot(X_test, y_test, c="tab:orange") ax.spines['bottom'].set_position('zero') ax.spines['left'].set_position('zero') ax.spines['top'].set_visible(False) ax.spines['right'].set_visible(False) ax.grid() ax.set_xlim(xmin, xmax) ax.set_ylim(ymin, ymax) ax.set_aspect('equal') plt.show() |
また、訓練結果の係数、切片とスコアについても同じ結果を得ることができる。
|
1 2 3 4 5 6 7 8 9 10 11 12 13 14 15 16 17 18 19 20 21 22 |
import numpy as np from sklearn.model_selection import train_test_split from sklearn.linear_model import LinearRegression from mglearn.datasets import make_wave X, y = make_wave(n_samples=60) X_train, X_test, y_train, y_test = train_test_split(X, y, random_state=42) linreg = LinearRegression() linreg.fit(X_train, y_train) print("coef_ : {}".format(linreg.coef_)) print("intercept_: {}".format(linreg.intercept_)) print("training score: {:.3f}".format(linreg.score(X_train, y_train))) print("test score : {:.3f}".format(linreg.score(X_test, y_test))) # coef_ : [0.39390555] # intercept_: -0.031804343026759746 # training score: 0.670 # test score : 0.659 |