概要
decision_function()は各データが推測したクラスに属する確信度(confidence)を表すが、超平面のパラメータに依存し、そのレンジや値の大きさと確信度の関係が明確ではない。
これに対してpredict_probaは、それぞれのターゲットが予測されたクラスに属する確率を0~1の実数で表す。2クラス分類では、結果の配列の形状は(n_sumples, 2)となる。
predict_proba()の挙動
以下はmake_circles()で生成した2クラスのデータをGradient Boostingによって分類したときの確信度。各データに対応した2要素の配列の1つ目がクラス0(blue)、2つ目がクラス1(orange)に属する確率を表し、2つの和は1となる。なお16行目でsuppress=Trueとすることで、ndarrayの表示を常に固定小数点としている。
|
1 2 3 4 5 6 7 8 9 10 11 12 13 14 15 16 17 18 19 20 21 22 23 24 25 |
import numpy as np from sklearn.ensemble import GradientBoostingClassifier from sklearn.datasets import make_circles from sklearn.model_selection import train_test_split X, y = make_circles(noise=0.25, factor=0.5, random_state=1) y_named = np.array(["blue", "orange"])[y] X_train, X_test, y_train, y_test, y_train_named, y_test_named = \ train_test_split(X, y, y_named, random_state=0) gbc = GradientBoostingClassifier(random_state=0) gbc.fit(X_train, y_train_named) pred_prob = gbc.predict_proba(X_test) np.set_printoptions(suppress=True) print(pred_prob) # [[0.01573626 0.98426374] # [0.84575653 0.15424347] # [0.98112869 0.01887131] # ..... # [0.06307595 0.93692405] # [0.93442475 0.06557525] # [0.86619957 0.13380043]] |
decision_function()との比較
先のコードに以下を続けて、predict_proba()による確率、予測されたクラス、decsion_function()の値と、各データの正解クラスを並べて表示する。予測されたクラスの方の確率が大きいこと、その予測結果とdecision_function()の符号が一致していることが確認できる。
|
1 2 3 4 5 6 7 8 9 10 11 12 13 14 15 16 17 18 19 |
prob0 = pred_prob[:, 0] prob1 = pred_prob[:, 1] data = DataFrame() data["prob0"] = prob0 data["prob1"] = prob1 data["pred"] = gbc.predict(X_test) data["dec_func"] = gbc.decision_function(X_test) data["correct"] = y_test_named print(data) # prob0 prob1 pred dec_func correct # 0 0.015736 0.984264 orange 4.135926 orange # 1 0.845757 0.154243 blue -1.701699 blue # 2 0.981129 0.018871 blue -3.951061 blue # ..... # 22 0.063076 0.936924 orange 2.698263 orange # 23 0.934425 0.065575 blue -2.656733 blue # 24 0.866200 0.133800 blue -1.867766 blue |
このデータをクラス0(blue)に対する確率(prob0)でソートし、decision_function()との関係を見てみると、以下のことがわかる。
- blueクラスの確率が高いと
decision_functionの確信度はマイナスで絶対値が大きくなり、orangeクラスの確率が高いと確信度はプラスで絶対値が大きくなる - blueクラスの確率とorangeクラスの確率が同程度の時、確信度の絶対値が同程度になり、符号が逆になる
- 確率に対して確信度は線形ではない
|
1 2 3 4 5 6 7 8 9 10 |
print(data.sort_values(by="prob0", ascending=False)) # prob0 prob1 pred dec_func correct # 6 0.999543 0.000457 blue -7.690972 blue # 10 0.998442 0.001558 blue -6.462560 blue # 15 0.984817 0.015183 blue -4.172312 orange # ..... # 0 0.015736 0.984264 orange 4.135926 orange # 11 0.013521 0.986479 orange 4.289866 orange # 4 0.013521 0.986479 orange 4.289866 orange |
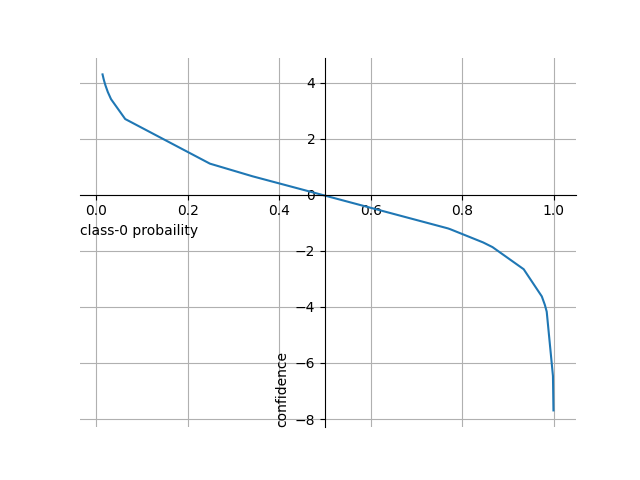
クラス0(blue)に対する確率とdecision_function()の確信度の関係を図示すると以下のようになり、確率に対して確信度が必ずしも線形になっていないことがわかる。

コードはmatplotlib.pyplotをインポートした上で、以下を追加。
|
1 2 3 4 5 6 7 8 9 10 11 12 13 |
prob = np.array(sorted_data["prob0"]) conf = np.array(sorted_data["dec_func"]) fig = plt.figure() ax = fig.add_subplot() ax.plot(prob, conf) ax.grid() ax.spines['top'].set_visible(False) ax.spines['right'].set_visible(False) ax.spines['bottom'].set_position('zero') ax.spines['left'].set_position(('data', 0.5)) ax.set_xlabel("class-0 probaility", loc='left') ax.set_ylabel("confidence", loc='bottom') plt.show() |
決定境界
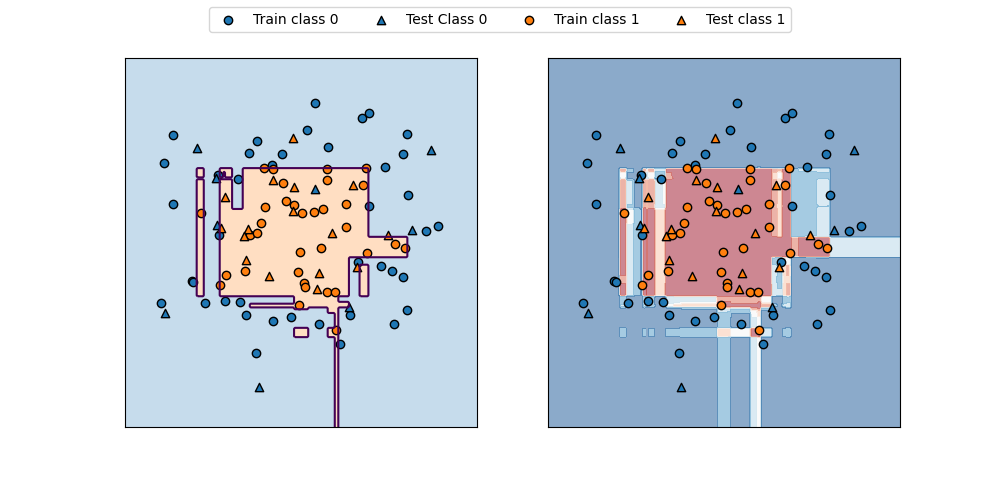
以下は、predict_proba()で計算された確率を可視化したもので、decision_function()の場合に比べて、直感的にも分かりやすい分布となっている。

コンターに表す値として、30行目でpredict_proba()の結果の0列目、すなわちClass0の確率を取り出している。
|
1 2 3 4 5 6 7 8 9 10 11 12 13 14 15 16 17 18 19 20 21 22 23 24 25 26 27 28 29 30 31 32 33 34 35 36 37 38 39 40 41 42 43 44 45 46 47 |
import numpy as np import matplotlib.pyplot as plt from sklearn.ensemble import GradientBoostingClassifier from sklearn.datasets import make_circles from sklearn.model_selection import train_test_split f0min, f0max = -1.5, 1.5 f1min, f1max = -1.75, 1.5 X, y = make_circles(noise=0.25, factor=0.5, random_state=1) X_train, X_test, y_train, y_test =\ train_test_split(X, y, random_state=0) gb = GradientBoostingClassifier(random_state=0) gb.fit(X_train, y_train) fig, axs = plt.subplots(1, 2, figsize=(10, 4.8)) color0, color1 = 'tab:blue', 'tab:orange' f0 = np.linspace(f0min, f0max, 200) f1 = np.linspace(f1min, f1max, 200) f0, f1 = np.meshgrid(f0, f1) F = np.hstack((f0.reshape(-1, 1), f1.reshape(-1, 1))) pred = gb.predict(F).reshape(f0.shape) axs[0].contour(f0, f1, pred, levels=[0.5]) axs[0].contourf(f0, f1, pred, levels=1, colors=[color0, color1], alpha=0.25) proba = gb.predict_proba(F)[:, 0].reshape(f0.shape) print(proba.shape) axs[1].contourf(f0, f1, proba, alpha=0.5, cmap='RdBu') for ax in axs: ax.scatter(X_train[y_train==0][:, 0], X_train[y_train==0][:, 1], marker='o', fc=color0, ec='k', label="Train class 0") ax.scatter(X_test[y_test==0][:, 0], X_test[y_test==0][:, 1], marker='^', fc=color0, ec='k', label="Test Class 0") ax.scatter(X_train[y_train==1][:, 0], X_train[y_train==1][:, 1], marker='o', fc=color1, ec='k', label="Train class 1") ax.scatter(X_test[y_test==1][:, 0], X_test[y_test==1][:, 1], marker='^', fc=color1, ec='k', label="Test class 1") ax.set_xlim(f0min, f0max) ax.set_ylim(f1min, f1max) ax.tick_params(left=False, bottom=False, labelleft=False, labelbottom=False) handles, labels = axs[0].get_legend_handles_labels() fig.legend(handles, labels, ncol=4, loc='upper center') plt.show() |
3クラス以上の場合
3クラスのirisデータセットにGradientBoostingClassifierを適用し、predict_proba()の出力を見てみる。
|
1 2 3 4 5 6 7 8 9 10 11 12 13 14 15 16 17 18 19 |
import numpy as np from sklearn.datasets import load_iris from sklearn.model_selection import train_test_split from sklearn.ensemble import GradientBoostingClassifier from pandas import DataFrame iris = load_iris() X_train, X_test, y_train, y_test = train_test_split( iris.data, iris.target, random_state=42) gbc = GradientBoostingClassifier(learning_rate=0.01, random_state=0) gbc.fit(X_train, y_train) pred_proba = gbc.predict_proba(X_test) df = DataFrame(pred_proba, columns=iris.target_names) df["decision"] = np.argmax(pred_proba, axis=1) df["prediction"] = gbc.predict(X_test) print(df) |
このコードの出力結果は以下の通り。3つのクラスに対する確率が得られ、合計は1になる。こちらはdecision_function()が2クラスの時だけ配列が1次元となるのと違って、どのような場合でも行数×列数=データ数×クラス数の配列になる。
なお17行目で、argmaxを使って各データで確率が最大となるクラスを探している。
|
1 2 3 4 5 6 7 8 9 10 11 12 |
setosa versicolor virginica decision prediction 0 0.102177 0.788400 0.109422 1 1 1 0.783471 0.109367 0.107161 0 0 2 0.098181 0.110059 0.791761 2 2 3 0.102177 0.788400 0.109422 1 1 4 0.103600 0.667239 0.229161 1 1 ..... 33 0.783471 0.109367 0.107161 0 0 34 0.783471 0.109367 0.107161 0 0 35 0.101941 0.115024 0.783035 2 2 36 0.102177 0.788400 0.109422 1 1 37 0.783471 0.109367 0.107161 0 0 |