概要
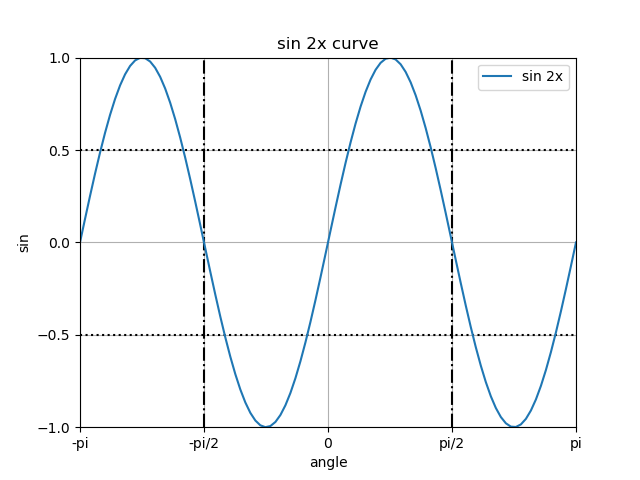
pyplotでグラフを描画する場合、pyplotのメソッドであるplotやxlimを使うのが簡易だが、figureオブジェクトの下にaxesオブジェクトを生成して操作する方法がある。ここではaxesオブジェクトによる方法を整理してみた。
|
1 2 3 4 5 6 7 8 9 10 11 12 13 14 15 16 17 18 19 20 21 22 23 24 25 26 27 28 29 30 31 32 |
import numpy as np import matplotlib.pyplot as plt x = np.linspace(-np.pi, np.pi, num=100, endpoint=True) y = np.sin(x*2) fig = plt.figure() ax = fig.add_subplot(111) ax.plot(x, y, label="sin 2x") # タイトル設定 ax.set_title("sin 2x curve") # x軸・y軸のラベル ax.set_xlabel("angle") ax.set_ylabel("sin") # x軸・y軸の範囲 ax.set_xlim(-np.pi, np.pi) ax.set_ylim(-1, 1) # x軸・y軸の目盛設定 ax.set_xticks([-np.pi, -np.pi/2, 0, np.pi/2, np.pi]) ax.set_xticklabels(["-pi", "-pi/2", "0", "pi/2", "pi"]) ax.set_yticks([-1, -0.5, 0, 0.5, 1]) # 凡例 ax.legend(loc="upper right") # 格子の表示 ax.grid(True) # 水平線・垂直線の表示 ax.hlines([-0.5, 0.5], -np.pi, np.pi, linestyles="dotted") ax.vlines([-np.pi/2, np.pi/2], -1, 1, linestyles="dashdot") plt.show() |

各メソッドの説明
axesオブジェクトの生成
ax = fig.add_subplot(arg)
figureオブジェクトからaxesオブジェクトを生成する。subplot()の引数argの指定方法には2通りある。
なお、figureオブジェクトに属するaxesオブジェクトが1つの場合は以下のような指定もできる。
fig, ax = plt.subplots()
以後、グラフの描画やグラフエリアに対する表示オプションの設定は、得られたaxesオブジェクトのメソッドで行う。
グラフタイトル
axes.set_title(label[, loc])
文字列labelをグラフ上部に表示する。表示位置はloc="left"/"center"/"right"で指定(デフォルトは"center")
軸の設定
軸ラベル
axes.set_xlabel(label)
axes.set_ylabel(label)
文字列labelをx軸/y軸のラベルとして設定する。
set_xlabel()/set_ylabel()~軸のラベル
軸のスケール
axes.set_xscale(scale)
axes.set_yscale(scale)
軸のスケールを設定する。スケールの種類は以下の通り。
'linear':通常の線形軸'log':対数軸'symlog':負の領域も含めた対数軸(−log (−x) for x < 0)'logit':?
軸の範囲
axes.set_xlim(left, right)
axes.set_ylim(bottom, top)
x軸・y軸の上限・下限を設定する。引数指定の変化などはpyplotのメソッドと同様。
軸目盛の設定
axes.set_xticks(ticks)
axes.set_yticks(ticks)
ticksのリスト等の要素で軸目盛を設定する。軸目盛のラベルを変更したい場合は、ticksと同じ要素数のlabelsで以下を実行する。
axes.set_xticklabels(labels)
axes.set_yticklabels(labels)
なお、軸のラベルを非表示にしたいときは、以下のように指定する。
|
1 2 3 4 |
axes.tick_params(labelbottom=False, labelleft=False, labelright=False, labeltop=False) |
軸目盛を非表示にしたいときは以下を指定。
|
1 |
axes.tick_params(bottom=False, left=False, right=False, top=False) |
軸の調整
- 軸の表示位置はspines()で指定する
- 複数グラフの外側だけに軸ラベル・目盛ラベルを表示するには、各Axesオブジェクトについて
Axes.label_outer()を実行する
凡例
pyplot.legend(loc=location)
データに設定されたラベルで、locationで指定した位置に凡例を表示する。locationの指定方法はpyplot.legendと同じ。
詳細はpyplot – legendを参照。
格子
pyplot.grid(True/False)
Trueを指定すると、軸目盛に対応した格子が描かれる。
水平線・垂直線
axes.hlines([y, xmin, xmax, colors='k', linestyles='solid', label='']
axes.vlines([x, ymin, ymax, colors='k', linestyles='solid', label='']
指定した位置に水平線・垂直線を描く。引数の指定方法はpyplot.legendと同じ。
テキスト
axes.text(x, y, str, size=size, color=color)
指定した位置にstrを表示させる。
参考サイト
pyplot→pltを使う方法、axes→axを使う方法などがネット上にもそれぞれ存在していたが、以下の記事がたいへん参考になった。感謝したい。