概要
k平均法(k-means clustering)はクラスタリングの手法の1つで、与えられたデータ群の特徴と初期値に基づいて、データを並列(非階層)のクラスターに分類する。
アルゴリズムはシンプルで、以下の手順。
- クラスターの数だけクラスターの代表点の初期値を設定する
- 代表点の位置が収束するまで以下を繰り返す
- データの各点から最も近い代表点を選ぶ
- 同じ代表点の点群から重心を算出し、新しい代表点の位置とする
このクラスは、特徴量が2つのデータ群と代表点の初期値を与えて、k平均法でクラスタリングを行うテストクラス。
2つの特徴量x_data、y_dataを与えてオブジェクトを生成し、代表点の初期値x_means、y_meansを与えてメソッドを実行して結果を得る。
全コード
KMeansClusteringクラスの全コードは以下の通り。
|
1 2 3 4 5 6 7 8 9 10 11 12 13 14 15 16 17 18 19 20 21 22 23 24 25 26 27 28 29 30 31 32 33 34 35 36 37 38 39 40 41 42 43 44 45 46 47 48 49 50 51 52 53 54 55 56 57 58 59 60 61 62 63 64 65 66 |
import numpy as np import sys class KMeansClustering: def __init__(self, x_data, y_data): self._x = x_data self._y = y_data self._x_means = None self._y_means = None self._num_data = len(self._x) self._num_means = 0 self._groups = np.empty((0, self._num_data), dtype=int) def _distance(self, x0, y0, x1, y1): return (x0 - x1)**2 + (y0 - y1)**2 def _point_converged(self, x0, y0, x1, y1): return True if x0==x1 and y0==y1 else False def _all_points_converged(self, x_old, y_old, x_new, y_new): for x0, y0, x1, y1 in zip(x_old, y_old, x_new, y_new): if not self._point_converged(x0, y0, x1, y1): return False return True def _set_nearest_mean_point(self): groups = np.zeros(self._num_data, int) for i, (x, y) in enumerate(zip(self._x, self._y)): min_dist = sys.float_info.max for j, (xm, ym) in \ enumerate(zip(self._x_means[-1], self._y_means[-1])): d = self._distance(x, y, xm, ym) if d < min_dist: groups[i] = j min_dist = d self._groups = np.vstack((self._groups, groups)) def _revise_mean_points(self): x_means_new = np.zeros(self._num_means) y_means_new = np.zeros(self._num_means) for k in range(self._num_means): target = [True if j==k else False for j in self._groups[-1]] x_means_new[k] = np.mean(self._x[target]) y_means_new[k] = np.mean(self._y[target]) return x_means_new, y_means_new def get_result(self, x_means, y_means): self._x_means = np.array([x_means.copy()]) self._y_means = np.array([y_means.copy()]) self._num_means = len(x_means) while True: self._set_nearest_mean_point() xm, ym = self._revise_mean_points() if self._all_points_converged( \ self._x_means[-1], self._y_means[-1], xm, ym): return self._x_means, self._y_means, self._groups else: self._x_means = np.vstack((self._x_means, xm)) self._y_means = np.vstack((self._y_means, ym)) return self._x_means, self._y_means, self._groups |
利用方法
クラスタリングを行うインスタンスの生成
初期データを与え、KMeansClusteringクラスのインスタンスを生成する。
|
1 |
clustering = KMeansClustering(x_data, y_data) |
コンストラクターに与える引数は以下の通り。
x_data,y_data- クラスタリングを行うデータの特徴量x、yの配列(1次元の
ndarray)。
クラスタリングの実行
生成したインスタンスに対して、クラスタリングを行うメソッドを実行して結果を得る。
|
1 |
xm, ym, groups = clustering.get_result(x_means, y_means) |
メソッドに与える引数は以下の通り。
x_means,y_means- k個のクラスターの代表点の初期値(1次元の
ndarray)。
結果は以下のタプルで与えられる。
x_means,y_means- クラスターの代表点のx、yの配列。収束までの各計算段階の値を記録しており、2次元の
ndarrayの各行が各計算ステップに相当。 groups- 各データが属するクラスター(代表点)番号の
ndarray。
実行例
以下のコードでKMeansClusteringクラスをテスト。内容は以下の通り。
- 2つの円状に散らばるランダムな点群を発生させ、1つのデータとしてまとめる
random_scatter_dataは指定した中心・半径の円内に指定した数のランダムな点を発生させるモジュールで、別途作成(最後の方にコードを掲載)
- クラスターの代表点の数と位置、散布図を描画するパラメーターを設定する
- プロットする図の数は2行3列で固定し、初期状態を除いた5つの図を表示させる
- 予め実行させてコンソールで収束回数を確認し、33行目で表示させる計算ステップを指定している
- 初期状態の散布図をプロット
- クラスタリングを行う
KMeansClustringオブジェクトを生成し、結果を得るためのメソッドを実行(53-54行目) - 結果をプロット
|
1 2 3 4 5 6 7 8 9 10 11 12 13 14 15 16 17 18 19 20 21 22 23 24 25 26 27 28 29 30 31 32 33 34 35 36 37 38 39 40 41 42 43 44 45 46 47 48 49 50 51 52 53 54 55 56 57 58 59 60 61 62 63 64 65 66 67 68 69 70 71 72 |
import numpy as np import matplotlib.pyplot as plt import random_scatter_data as rsd from k_means_clustering import KMeansClustering ################################################## # generate random points # np.random.seed(10) num_data_1 = 100 num_data_2 = 100 x1, y1 = rsd.scatter_in_circle(15, 15, 10, num=num_data_1) x2, y2 = rsd.scatter_in_circle(25, 25, 10, num=num_data_2) x_data = np.hstack((x1, x2)) y_data = np.hstack((y1, y2)) ################################################## # settings # k = 2 x_means = np.zeros(k) y_means = np.zeros(k) x_means[0], y_means[0] = 15, 15 x_means[1], y_means[1] = 20, 15 x_lim = 40 y_lim = 40 plot_steps = [0, 1, 2, 4, 6] plot_rows = 2 plot_cols = 3 ################################################## # plot initial state with original cluster # fig = plt.figure(figsize=(8, 6)) ax = fig.add_subplot(plot_rows, plot_cols, 1, aspect=1.0) ax.set_xlim(0, x_lim) ax.set_ylim(0, y_lim) ax.scatter(x1, y1, s=5) ax.scatter(x2, y2, s=5) ax.scatter(x_means, y_means, c='red', marker='x') ################################################## # create clustring object and get result # clustering = KMeansClustering(x_data, y_data) xm, ym, groups = clustering.get_result(x_means, y_means) print("convergion times = {}".format(len(xm))) for n_mean in range(k): print("[{}, {}]".format(xm[-1][n_mean], ym[-1][n_mean])) ################################################## # plot the states of designated steps # for n_plot, n_step in enumerate(plot_steps): ax = fig.add_subplot(plot_rows, plot_cols, n_plot + 2, aspect=1.0) ax.set_xlim(0, x_lim) ax.set_ylim(0, y_lim) for j in range(k): target = [True if jj==j else False for jj in groups[n_step]] ax.scatter(x_data[target], y_data[target], s=5) ax.scatter(xm[n_step], ym[n_step], marker='x') plt.show() |
このコードの実行結果はコンソールで以下のように表示される。
|
1 2 3 4 |
convergion times = 7 [14.567003574164632, 15.215775486294216] [25.31190419286806, 25.871321239241027] [Finished in 3.529s] |
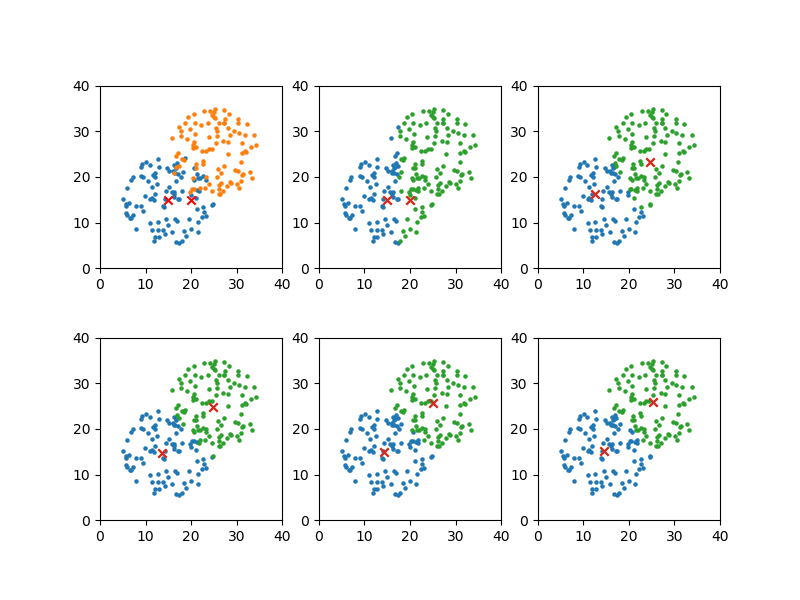
この結果から1、2、3、5、7回目の計算結果を図示するよう上のコードでセットした表示結果は以下の通り。

グループが比較的明確なので、早い段階で代表点の位置が定まっている。
クラス説明
__init__()~インスタンス生成
|
1 2 3 4 5 6 7 8 |
def __init__(self, x_data, y_data): self._x = x_data self._y = y_data self._x_means = None self._y_means = None self._num_data = len(self._x) self._num_means = 0 self._groups = np.empty((0, self._num_data), dtype=int) |
クラスタリングを行うデータの特徴量x_data、y_dataをndarrayで与えてインスタンスを生成。
プライベート・メンバーは以下の通り。
_x,_y- クラスタリングを行うデータの2つの特徴量の配列。計算過程で変更されない。
_x_means,_y_means- 代表点の計算結果を保存していく配列。分析実行時に初期値が与えられるため、初期値はNone。
_num_data- データの個数。
_num_means- 代表点(クラスターの個数)。代表点が分析実行時に与えられるため、初期値は0。
_groups- 各データの属するクラスターを保存していく配列。
get_result()~分析の実行
|
1 2 3 4 5 6 7 8 9 10 11 12 13 14 15 16 17 |
def get_result(self, x_means, y_means): self._x_means = np.array([x_means.copy()]) self._y_means = np.array([y_means.copy()]) self._num_means = len(x_means) while True: self._set_nearest_mean_point() xm, ym = self._revise_mean_points() if self._all_points_converged( \ self._x_means[-1], self._y_means[-1], xm, ym): return self._x_means, self._y_means, self._groups else: self._x_means = np.vstack((self._x_means, xm)) self._y_means = np.vstack((self._y_means, ym)) return self._x_means, self._y_means, self._groups |
k個の代表点のx、yを引数として渡し、結果を得る。
引数
_x_means,_y_means- k個の代表点の初期値x、yを、それぞれ1次元の
ndarrayで与える。引数で与えた配列は変更されない。
戻り値
x_means,y_means- 代表点の計算結果が保存された配列。各行は計算ステップに相当。
groups- 各計算ステップにおける、各点のクラスターが保存された配列。各行は計算ステップに相当。
処理内容
- 代表点の初期値をプライベート・メンバーにコピーし、代表点の個数をセット
- 全ての代表点の位置が収束するまで、以下を繰り返す
- 各データについて、最も近い代表点をセット
- 共通の代表点を持つデータから、新しい代表点の位置を計算
- 代表点の前回最後の計算値と今回の計算値が収束したならループ終了、でなければ計算結果を追加してループ継続
- 計算結果を戻り値として終了
プライベートメソッド
_distance()~2点間の距離
|
1 2 |
def _distance(self, x0, y0, x1, y1): return (x0 - x1)**2 + (y0 - y1)**2 |
2つの点の距離を与える。ここではユークリッド距離の2乗。
_point_converged()~収束判定
|
1 2 |
def _point_converged(self, x0, y0, x1, y1): return True if x0==x1 and y0==y1 else False |
2つの点の座標から、点の位置が収束したかどうかを判定。
本来、各座標値はfloatなので'=='による判定は危険だが、ここでは収束の速さと確実性を信じて簡易に設定。
_all_points_converged()~全ての点の収束判定
|
1 2 3 4 5 |
def _all_points_converged(self, x_old, y_old, x_new, y_new): for x0, y0, x1, y1 in zip(x_old, y_old, x_new, y_new): if not self._point_converged(x0, y0, x1, y1): return False return True |
配列で与えた2組の点がすべて収束条件を満たしているか判定。
_set_nearest_mean_point()~各点に最も近い代表点
|
1 2 3 4 5 6 7 8 9 10 11 |
def _set_nearest_mean_point(self): groups = np.zeros(self._num_data, int) for i, (x, y) in enumerate(zip(self._x, self._y)): min_dist = sys.float_info.max for j, (xm, ym) in \ enumerate(zip(self._x_means[-1], self._y_means[-1])): d = self._distance(x, y, xm, ym) if d < min_dist: groups[i] = j min_dist = d self._groups = np.vstack((self._groups, groups)) |
処理内容
- 各データについて、それぞれから最も近い距離にある代表点を探し、その番号を1次元の配列
groupsに記録 _groups配列に、今回の分類結果を行として追加
_revise_mean_points()~代表点の更新
|
1 2 3 4 5 6 7 8 9 10 |
def _revise_mean_points(self): x_means_new = np.zeros(self._num_means) y_means_new = np.zeros(self._num_means) for k in range(self._num_means): target = [True if j==k else False for j in self._groups[-1]] x_means_new[k] = np.mean(self._x[target]) y_means_new[k] = np.mean(self._y[target]) return x_means_new, y_means_new |
同じ代表点に属するデータからそれらの重心を計算し、新しい代表点として返す。
random_scatter_data.py
今回整理のためにつくったモジュールで、内容は以下の通り。
|
1 2 3 4 5 6 7 8 9 10 11 12 13 14 15 16 17 18 19 20 21 |
import numpy as np def scatter_in_circle(x_org=0, y_org=0, r=1, num=100): x = np.zeros(num) y = np.zeros(num) for i in range(num): while True: xw = np.random.rand() * 2 * r - r yw = np.random.rand() * 2 * r - r if xw*xw + yw*yw <= r*r: x[i], y[i] = xw + x_org, yw + y_org break return x, y def scatter_in_2dnormal(x_org=0, y_org=0, r=1, nsigma=1, num=100): x = np.random.randn(num) * r/nsigma + x_org y = np.random.randn(num) * r/nsigma + y_org return x, y |


